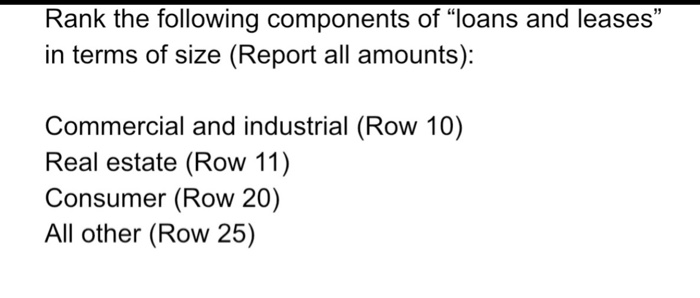
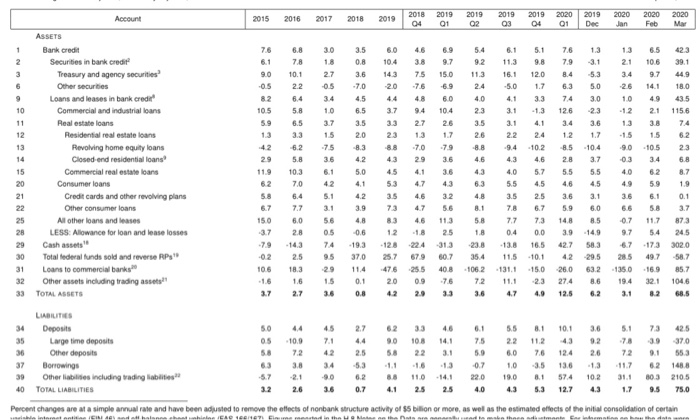
Rank the following components of loans and leases in terms of size (Report all amounts): Commercial and industrial (Row 10) Real estate (Row 11) Consumer (Row 20) All other (Row 25) 2018 2015 Account 2016 2017 2018 2019 2019 2 2019 0 2 2019 03 2019 04 2020 01 2019 Dec 2020 Jan 2020 Feb 2020 Mar 7.6 6.1 9.0 6.8 78 10.1 3.0 18 2.7 ASSETS Bank credit Securities in bank credit Treasury and agency securities Other securities Loans and leases in bank credit Commercial and industrial loans Real estate loans Residential real estate loans Revolving home equity loans Closed-end residential loans Commercial real estate loans Consumer loans Credit cards and other revolving plans Other consumer loans All other loans and leases LESS: Allowance for loan and lease losses Cash assets Total lederal funds sold and reverse RP, Loans to commercial banks Other assets including trading assets TOTAL ASSETS 3. 5 6 0 46 08104 38 3. 6 143 75 -7.0 2.0 76 4.4 48 3.7 9.4 33 27 23 13 8.8 7.0 43 2 9 45 4.1 53 4.7 3.5 4.6 3.9 73 4.7 48 8.3 4.6 -06 12 18 19.3 128 -224 37.0 25.7 67.9 11.4 476 25.5 0.1 20 0.9 0.8 4.2 2.9 69 97 150 6.9 60 10.4 26 17 7.9 3.6 3.6 4.3 3.2 5.6 11.3 25 313 60.7 40.8 7.6 3.3 5.4 6.1 51 76 13 92 113 98 7931 11.3 161 120 34 53 2.4 -5. 0 1 .7 6.3 5.0 40 41 3. 3 74 3.0 23 3.1 1.3 126 23 3.5 31 41 34 36 2622 24 12 1.7 8.8 -9.4 10.2 8.5 10.4 4.6 4.3 4.6 2.8 3.7 4.3 4.0 5.7 55 55 6.3 5.5 4.5 4.6 4.5 4.8 3.5 2.5 3.6 3.1 8.1 7.8 6.7 5.9 6.0 5. 8 7 .7 73 148 8.5 18 0.4 0.0 3.9 14.9 23.8 13.8 16.5 427 583 35. 4 11.5 -10. 1 42 29.5 106.2 131.1 15.0 26.0 63.2 72 11.1 2.3 274 8.6 3.6 4.7 4.9 12.5 6.2 13 6.5 423 21 10 6 391 34 97 449 26 14.1 18.0 1. 0 49 43.5 12 2.1 1156 13 38 74 -15 15 6.2 -9.0 10.5 23 03 3.4 6.8 40 62 8.7 4.9 5.9 1.9 3.6 6.1 0.1 6.6 5.8 3.7 -0.7 11.7 873 9.7 5.4 24.5 67 173 3020 28.5 49. 7 58.7 1350 16.9 85.7 19.4 32.1 1046 3.1 8.2 68.5 15.0 30 32 33 34 LABILITIES Deposits Large time deposits Other deposits Borrowings Other labies including trading abilities TOTAL LIABILITIES 5.0 0.5 5.8 63 57 3.2 44 10.9 7. 2 3.8 2.1 2.6 45 7.1 4 2 34 2.0 3.6 2.7 4.4 2.5 -5.3 6.2 0.7 62 90 58 1.1 88 4.1 33 108 22 -1.6 110 2.5 46 14.1 3.1 -1.3 14.1 2.5 6.1 7.5 5.9 -0. 7 22. 0 4.0 5.5 2.2 6.0 1 0 10. 0 4.3 8.1 10.1 3.6 11.2 4.3 9.2 7.6 12.4 2.6 -3.5 136 13 8. 1574102 5.3 12.7 4.3 5.1 7.8 72 .117 31. 1 1.7 73 42.5 3.9 370 9.1 553 62 148.8 03 2105 9. 5 75.0 37 40 Percent changes are at a simple annual rate and have been adjusted to remove the effects of nonbank structure activity of $5 billion or more, as well as the estimated effects of the initial consolidation of certain


