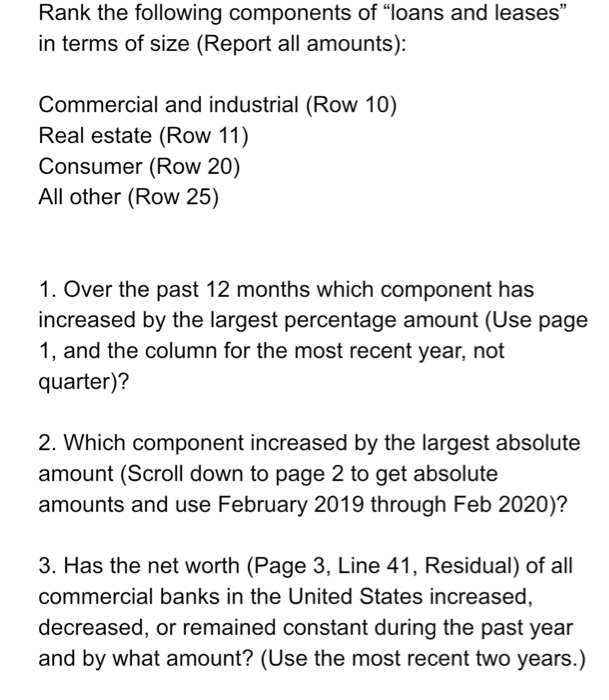
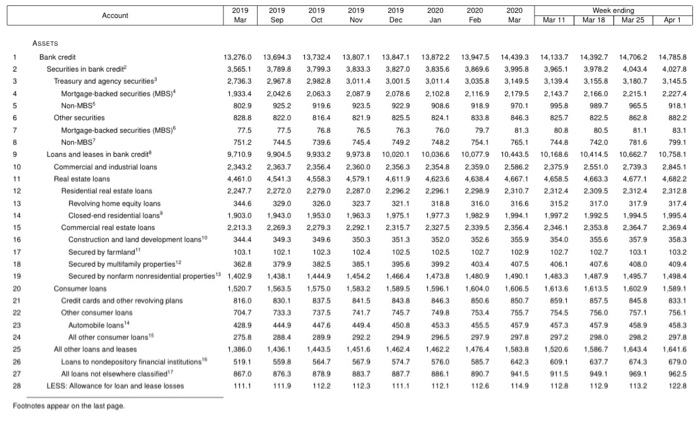
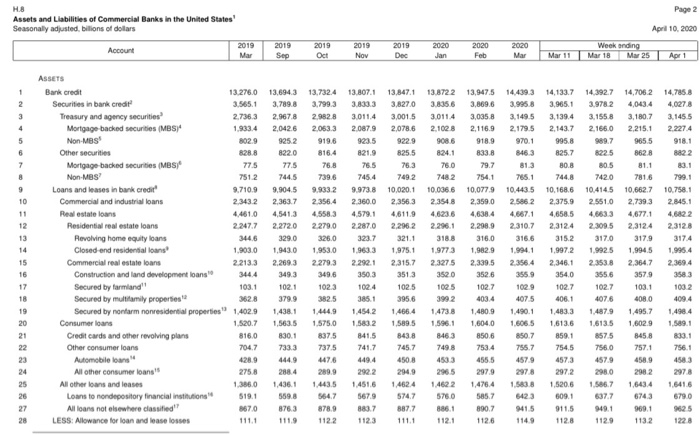
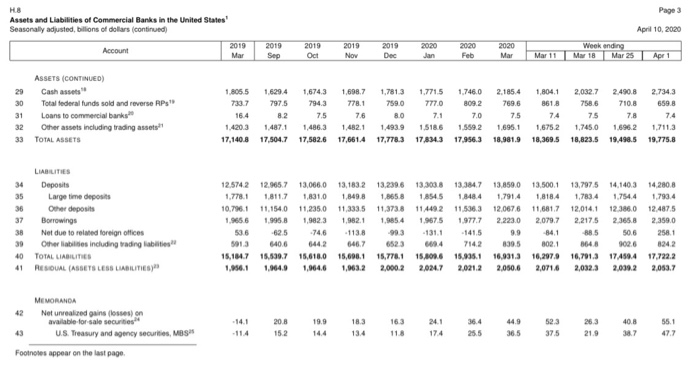
Rank the following components of "loans and leases in terms of size (Report all amounts): Commercial and industrial (Row 10) Real estate (Row 11) Consumer (Row 20) All other (Row 25) 1. Over the past 12 months which component has increased by the largest percentage amount (Use page 1, and the column for the most recent year, not quarter)? 2. Which component increased by the largest absolute amount (Scroll down to page 2 to get absolute amounts and use February 2019 through Feb 2020)? 3. Has the net worth (Page 3, Line 41, Residual) of all commercial banks in the United States increased, decreased, or remained constant during the past year and by what amount? (Use the most recent two years.) Account Mar 2019 Sep 2019 Oct 2019 Nov 2019 Dec 2020 Jan 2020 Feb 2020 Mar Mar 11 Mar 18 Mar 25 Apr 1 ASSETS 13.276.0 3.565.1 2.736.3 1,933.4 802.9 828.8 77.5 2 7512 Bank credit Securities in bank credit Treasury and agency securities Mortgage backed securities (MBS* Non-MBS Other securities Mortgage-backed securities (MES) Non-MBS Loans and leases in bank credit Commercial and industrial loans Real estate loans Residential real estate loans Revolving home equity loans Closed-end residential loans Commercial real estate loans Construction and land development loans Secured by farmland" Secured by multifamily properties Secured by nonfarm nonresidential properties Consumer loans Credit cards and other revolving plans Other consumer loans Automobilelong All other consumer loans All other loans and leases Loans to nondepository financial institutions All loans not elsewhere classified LESS: Allowance for loan and lease losses 9,710.9 2.3432 4,461,0 2.247,7 344.6 1,903.0 2.213.3 344.4 103.1 362.8 1,402.9 15207 816.0 704. 7 428. 9 275.8 1.386.0 519 1 8670 1111 13.694.3 3.789.8 2.9878 20426 9252 822.0 775 7445 9.904.5 2.363.7 4.541 3 2272 0 329.0 1.943.0 2.269.3 349.3 102.1 379.9 1.438.1 15635 830.1 7333 444.9 2184 1.416. 1 5598 876.3 111.9 13,732.4 3.799.3 2.982 8 2,0633 9196 8164 7.8 7396 9,933.2 2.356.4 4,5583 2 2790 326. 0 1,953.0 2.279.3 349.6 102.3 3825 1.444.9 1,5750 837,5 7375 4476 2099 1.443.5 5647 8789 1122 13.807,1 3.833.3 3 .0114 2.0879 923. 5 821. 9 76.5 7454 9.973.8 2.360.0 4.579.1 2.287 0 3 23.7 1.963.3 2.292.1 350.3 1024 385.1 1.4542 1.5832 841.5 741.7 4494 2922 1.451.6 5679 883.7 1123 13,847,1 13,872 2 3.8270 3 .835.6 3.0015 3.0114 2.078 6 2 .102 8 9229 908.6 825 5 8241 783 760 7492748. 2 10.020. 1 10.036.6 2356 3 2.3548 4.611946236 2 2962 2 296.1 321.1 318.8 1,975.1 1.977. 3 2.315.7 2.327.5 351 3 352.0 1025 102.5 395 6 399.2 1 4664 1473.8 1.5895 1.596.1 8438 8463 745.7 749.8 4508 2049 2005 1.46241462 2 574 7 576.0 877 886. 1 111. 1 1121 13.9475 14.439,3 14,133,7 14,3927 14,706 2 3.869.6 3.995.8 3.965.1 3.978 2 4,0434 3.035 8 3,149. 5 3 ,1394 3.1558 3.180.7 21169 2.179.5 2.143.7 2.1660 2215. 1 918 9 970. 1 995.8 989.7 965 5 833 8 846.3 825.7 8225 8628 29.7 81. 3 8 0.8 80.5 81.1 7541765174487420 781.6 10.077.9 10,443.5 10,168.6 10.414.5 10.662.7 2359 0 2.586.2 2.3759 2551027393 46384 4,667,1 4,658 5 46633 4.677.1 2 2989 2.310.7 2 3124 2309 5 2 312 4 316,0 316. 6 3 152 317.0 317.9 1 .9829 1,994.1 1.997.2 1.992 5 1.9945 2339 5 2.356.4 2.346. 1 2 .353.8 2.364.7 352.6 355.9 354. 0 3 556 357. 9 102. 7 1 029 102.7 102.7 1031 403.4 407,5 406.1 4076 408.0 1.4309 1.490.1 14833 14879 1.4957 1.6040 1,606.5 1,613,6 1613 5 1.6029 8506 850.7 859. 1 85758458 753 4 755.7 754. 5 7 56 0 7 57.1 457.9 4573 2979 2 97.8 2972 290 2982 1.4764 1.583.8 1.5206 1.5867 1643 4 55.7 642 3 6091 6377 6743 8 90.7 9415 9115 949. 1 969.1 1126 114.9 1128 129 1132 14.7858 4,0278 3.145.5 .2274 918.1 8822 83.1 799.1 10.758.1 28451 46822 23128 317.4 1,995.4 2.369.4 3 58.3 1032 409.4 1498 4 1,589.1 833.1 7561 4583 2978 1,641.6 6790 962,5 122.8 4533 Footnotes appear on the last page Page 2 Assets and Liabilities of Commercial Banks in the United States Seasonally adjusted. bilions of dollars April 10, 2020 Account 2019 Mar 2019 Sep 2019 Oct 2019 Nov 2019 Dec 2020 Jan 2 020 Feb 2 020 Mar Mar 11 Week onding Mar 18 Mar 25 Apr 1 1 13.276.0 3.565.1 2.736.3 1.933.4 8029 14.785 8 4.0278 3.145 5 2.227.4 775 775 7512 9.710.9 2.343.2 4.4610 2 247.7 ASSETS Bank credit Securities in bank credit Treasury and agency securities Mortgage backed securities (MBS Non-MBS Other securities Mortgage-backed securities (MBS Non-MBS Loans and leases in bank credit Commercial and industrial loans Real estate loans Residential real estate loans Revolving home equity loans Closed and residential loans Commercial real estate loans Construction and land development loans Secured by farmland Secured by multifamily properties Secured by nontam nonresidential properties Consumer loans Credit cards and other revolving plans Other consumer loans Automobile loans All other consumer loans All others and leases Loans to nendepository financial institutions All loans not elsewhere classified LESS: Allowance for loan and lease losses 13,694.3 13.732.4 13.807.1 13.847.1 3.789 3.7993323 3270 3.833.3 3.8270 2.967.8 2.982.8 3011.4 3.001. 5 2,042,6 2,063.3 2.087.9 2,078.6 925 2 919.6 923. 5 9229 8220 816.4 821. 9 825.5 76.8 76.5 783 744.5 7396 7454 2454 2409 7492 9.9045 99332 9.973.8 10.020.1 2.363.7 2356.4 2360.0 2.356. 3 4,541.3 4.5583 4579,1 4,611,9 2 2720 2.279.0 22870 22962 329.0 326,0 323 7 321.1 1.943.0 1.953.0 1.963.3 1.975.1 2.269322793 2.292.1 2.315.7 349.3 3496 350.3 351.3 1021 1023 1024 1025 3851 1,438.1 1,444.9 1.454.2 1,466.4 1.5635 1.583.2 1.589.5 830.1 8415 843.8 7417 745.7 4449 4476 4494 450.8 2884 2899 292 2 2949 1,436.1 1.443.5 1.451.6 14624 569.8 564.7 567.9 574.7 876.3 8789 883. 7 887.7 1 119 1122 1123 111.1 13.8722 3.8356 3 011.4 2.102.8 908 6 24.1 760 748 2 10.0366 2 3548 4.6236 2 296.1 318 1.9773 23275 3520 1025 3992 1.4738 1.596.1 846 3 7498 4533 296.5 1.4622 5760 886.1 112.1 1.903.0 2 2133 344.4 13,947.5 14.439,3 14,133.7 3,869.6 0 3.958 3.9651 3.035.8 3.149.5 3,139.4 2,116.9 2.179.5 2.143.7 918 9 970. 19958 8338 846 3 8257 29.7 813 80.8 7541 765.1 744,8 10,077.9 10.443 5 10.168.6 2,359.0 2586 2 2.375.9 4,638 4 4.667.1 4.658.5 2.298.9 2.310.7 2 3124 3160 3166 315.2 1,982.9 1.994.1 1.997.2 2.339.5 2356.4 2.346.1 352.6 355 9 3540 102.7 1029 1027 403 4 407 5 406.1 1,480.9 1.490.1 1.4833 1.6040 1.606.5 1,613.6 850.6 850.7 859.1 753 4 79.7 754.5 455.5 4579 457.3 29792978 2972 1,476.4 1.583.8 1.520.6 585.7 609.1 890.7 941.5 9115 1126 1149 1128 14,392.7 14,706 2 39782 4 0434 3.155.8 3,180.7 2.166.0 2.215.1 9897 965.5 2258628 80.5 81.1 7420 781.6 10.414.5 10,662.7 2.551.0 2,739.3 4.633 4,6771 2.30952.3124 317.0 317.9 1.992.5 1.9945 23538 2,364.7 355.6 3579 102.7 103.1 4076 4080 1.4879 1.495.7 1.613 5 1.6029 8575 8122 831 799.1 10.758.1 2.845.1 4.6822 23128 3174 1.995.4 2.3694 1031 1002 3799 3825 1.498 4 1.549.1 833.1 3628 1,402.9 1520.7 8160 7047 4289 275.8 1,386,0 457.9 2980 1.586.7 637.7 949. 1 1129 458.9 298 2 1.6434 6743 969.1 113.2 2978 1.6416 6790 9625 1228 8670 111. 1 Page 3 Assets and Liabilities of Commercial Banks in the United States Seasonally adjusted, billions of dollars (continued April 10, 2020 2019 Account 2019 Mar 2019 Sep 2019 Oct 2019 Nov 2020 Jan 2020 Feb 2020 Mar M ar 11 M 18 Mar 25 Apr 1 2.734.3 659.8 30 31 32 33 ASSETS CONTINUED) Cash assets Total federal funds sold and reverse RPS" Loans to commercial banks Other assets including trading assets TOTAL ASSETS 1.806.5 733.7 16.4 1.420.3 17,140.8 1629.4 797.5 2 8. 1.4871 17.504.7 1,674.3 794. 3 7 .5 1.486.3 17.582.6 1,698.7 7 78.1 7.6 1.482.1 17,661.4 1,781.3 759.0 8.0 1.493. 9 17,778.3 1.771.5 777.0 7.1 1 5186 17.834.3 1.746.0 809. 2 7.0 1559.2 17.956.3 2.185.4 7 69. 6 7.5 1.6951 18.981.9 1,804. 1 8 61.8 74 1.675.2 18,369.5 2.032.7 758.6 75 1.745.0 18,823.5 2.490.8 710.8 78 1.696.2 19.498.5 1.711.3 19.775.8 1 37 38 LIABILITIES Deposits Large time deposits Other deposits Borrowings Net due to related foreign offices Other abilities including trading able TOTAL LIABILITIES RESIDUAL (ASSETS LESS LIABILITIES) 12.574.2 1.778.1 10.796.1 1.9656 536 5013 15,104.7 1,956.1 12.965.7 13,066,0 1.811.7 1,831,0 11.154,0 11,235,0 1995.8 1,962,3 62 5 74, 6 64066442 15,599.7 15,618,0 1.949 1,9646 13,183.2 1,849.8 11,333.5 1,982.1 1138 646.7 15,698.1 1,963.2 13.239.6 1.8658 11.373.8 1.985.4 -993 6523 15,778.1 2,000.2 13.303.8 1854. 5 11449.2 1.967.5 131.1 4 15,809.6 2,024.7 13.384.7 .848.4 11.536.3 1.977.7 141,5 7142 15.995.1 2.021.2 13.8590 1.791.4 12.067,6 2.223.0 9. 9 830.5 16,931.3 2,050.6 13,500.1 1,818.4 11,681.7 2.079.7 84,1 802. 1 16,297,9 2,0716 13,7975 1,783.4 12.014.1 2.217.5 88. 5 3648 16,791.3 2,032,3 14.140.3 1.754.4 12.386.0 2.365.8 50. 6 902.6 17459.4 2,039.2 14.280.8 1.793.4 12.487.5 2,359.0 258.1 8242 17.722.2 2,053.7 40 41 42 MEMORANDA Net unrealized gains losses) on available for sale securities U.S. Treasury and agency securities, MBS - 14. 1 114 20. 8 152 19.9 144 18. 3 134 16.3 11.8 24. 1 174 36. 4 25.5 44.9 36.5 52. 3 375 26 3 219 408 38.7 55.1 47.7 Footnotes appear on the last page Rank the following components of "loans and leases in terms of size (Report all amounts): Commercial and industrial (Row 10) Real estate (Row 11) Consumer (Row 20) All other (Row 25) 1. Over the past 12 months which component has increased by the largest percentage amount (Use page 1, and the column for the most recent year, not quarter)? 2. Which component increased by the largest absolute amount (Scroll down to page 2 to get absolute amounts and use February 2019 through Feb 2020)? 3. Has the net worth (Page 3, Line 41, Residual) of all commercial banks in the United States increased, decreased, or remained constant during the past year and by what amount? (Use the most recent two years.) Account Mar 2019 Sep 2019 Oct 2019 Nov 2019 Dec 2020 Jan 2020 Feb 2020 Mar Mar 11 Mar 18 Mar 25 Apr 1 ASSETS 13.276.0 3.565.1 2.736.3 1,933.4 802.9 828.8 77.5 2 7512 Bank credit Securities in bank credit Treasury and agency securities Mortgage backed securities (MBS* Non-MBS Other securities Mortgage-backed securities (MES) Non-MBS Loans and leases in bank credit Commercial and industrial loans Real estate loans Residential real estate loans Revolving home equity loans Closed-end residential loans Commercial real estate loans Construction and land development loans Secured by farmland" Secured by multifamily properties Secured by nonfarm nonresidential properties Consumer loans Credit cards and other revolving plans Other consumer loans Automobilelong All other consumer loans All other loans and leases Loans to nondepository financial institutions All loans not elsewhere classified LESS: Allowance for loan and lease losses 9,710.9 2.3432 4,461,0 2.247,7 344.6 1,903.0 2.213.3 344.4 103.1 362.8 1,402.9 15207 816.0 704. 7 428. 9 275.8 1.386.0 519 1 8670 1111 13.694.3 3.789.8 2.9878 20426 9252 822.0 775 7445 9.904.5 2.363.7 4.541 3 2272 0 329.0 1.943.0 2.269.3 349.3 102.1 379.9 1.438.1 15635 830.1 7333 444.9 2184 1.416. 1 5598 876.3 111.9 13,732.4 3.799.3 2.982 8 2,0633 9196 8164 7.8 7396 9,933.2 2.356.4 4,5583 2 2790 326. 0 1,953.0 2.279.3 349.6 102.3 3825 1.444.9 1,5750 837,5 7375 4476 2099 1.443.5 5647 8789 1122 13.807,1 3.833.3 3 .0114 2.0879 923. 5 821. 9 76.5 7454 9.973.8 2.360.0 4.579.1 2.287 0 3 23.7 1.963.3 2.292.1 350.3 1024 385.1 1.4542 1.5832 841.5 741.7 4494 2922 1.451.6 5679 883.7 1123 13,847,1 13,872 2 3.8270 3 .835.6 3.0015 3.0114 2.078 6 2 .102 8 9229 908.6 825 5 8241 783 760 7492748. 2 10.020. 1 10.036.6 2356 3 2.3548 4.611946236 2 2962 2 296.1 321.1 318.8 1,975.1 1.977. 3 2.315.7 2.327.5 351 3 352.0 1025 102.5 395 6 399.2 1 4664 1473.8 1.5895 1.596.1 8438 8463 745.7 749.8 4508 2049 2005 1.46241462 2 574 7 576.0 877 886. 1 111. 1 1121 13.9475 14.439,3 14,133,7 14,3927 14,706 2 3.869.6 3.995.8 3.965.1 3.978 2 4,0434 3.035 8 3,149. 5 3 ,1394 3.1558 3.180.7 21169 2.179.5 2.143.7 2.1660 2215. 1 918 9 970. 1 995.8 989.7 965 5 833 8 846.3 825.7 8225 8628 29.7 81. 3 8 0.8 80.5 81.1 7541765174487420 781.6 10.077.9 10,443.5 10,168.6 10.414.5 10.662.7 2359 0 2.586.2 2.3759 2551027393 46384 4,667,1 4,658 5 46633 4.677.1 2 2989 2.310.7 2 3124 2309 5 2 312 4 316,0 316. 6 3 152 317.0 317.9 1 .9829 1,994.1 1.997.2 1.992 5 1.9945 2339 5 2.356.4 2.346. 1 2 .353.8 2.364.7 352.6 355.9 354. 0 3 556 357. 9 102. 7 1 029 102.7 102.7 1031 403.4 407,5 406.1 4076 408.0 1.4309 1.490.1 14833 14879 1.4957 1.6040 1,606.5 1,613,6 1613 5 1.6029 8506 850.7 859. 1 85758458 753 4 755.7 754. 5 7 56 0 7 57.1 457.9 4573 2979 2 97.8 2972 290 2982 1.4764 1.583.8 1.5206 1.5867 1643 4 55.7 642 3 6091 6377 6743 8 90.7 9415 9115 949. 1 969.1 1126 114.9 1128 129 1132 14.7858 4,0278 3.145.5 .2274 918.1 8822 83.1 799.1 10.758.1 28451 46822 23128 317.4 1,995.4 2.369.4 3 58.3 1032 409.4 1498 4 1,589.1 833.1 7561 4583 2978 1,641.6 6790 962,5 122.8 4533 Footnotes appear on the last page Page 2 Assets and Liabilities of Commercial Banks in the United States Seasonally adjusted. bilions of dollars April 10, 2020 Account 2019 Mar 2019 Sep 2019 Oct 2019 Nov 2019 Dec 2020 Jan 2 020 Feb 2 020 Mar Mar 11 Week onding Mar 18 Mar 25 Apr 1 1 13.276.0 3.565.1 2.736.3 1.933.4 8029 14.785 8 4.0278 3.145 5 2.227.4 775 775 7512 9.710.9 2.343.2 4.4610 2 247.7 ASSETS Bank credit Securities in bank credit Treasury and agency securities Mortgage backed securities (MBS Non-MBS Other securities Mortgage-backed securities (MBS Non-MBS Loans and leases in bank credit Commercial and industrial loans Real estate loans Residential real estate loans Revolving home equity loans Closed and residential loans Commercial real estate loans Construction and land development loans Secured by farmland Secured by multifamily properties Secured by nontam nonresidential properties Consumer loans Credit cards and other revolving plans Other consumer loans Automobile loans All other consumer loans All others and leases Loans to nendepository financial institutions All loans not elsewhere classified LESS: Allowance for loan and lease losses 13,694.3 13.732.4 13.807.1 13.847.1 3.789 3.7993323 3270 3.833.3 3.8270 2.967.8 2.982.8 3011.4 3.001. 5 2,042,6 2,063.3 2.087.9 2,078.6 925 2 919.6 923. 5 9229 8220 816.4 821. 9 825.5 76.8 76.5 783 744.5 7396 7454 2454 2409 7492 9.9045 99332 9.973.8 10.020.1 2.363.7 2356.4 2360.0 2.356. 3 4,541.3 4.5583 4579,1 4,611,9 2 2720 2.279.0 22870 22962 329.0 326,0 323 7 321.1 1.943.0 1.953.0 1.963.3 1.975.1 2.269322793 2.292.1 2.315.7 349.3 3496 350.3 351.3 1021 1023 1024 1025 3851 1,438.1 1,444.9 1.454.2 1,466.4 1.5635 1.583.2 1.589.5 830.1 8415 843.8 7417 745.7 4449 4476 4494 450.8 2884 2899 292 2 2949 1,436.1 1.443.5 1.451.6 14624 569.8 564.7 567.9 574.7 876.3 8789 883. 7 887.7 1 119 1122 1123 111.1 13.8722 3.8356 3 011.4 2.102.8 908 6 24.1 760 748 2 10.0366 2 3548 4.6236 2 296.1 318 1.9773 23275 3520 1025 3992 1.4738 1.596.1 846 3 7498 4533 296.5 1.4622 5760 886.1 112.1 1.903.0 2 2133 344.4 13,947.5 14.439,3 14,133.7 3,869.6 0 3.958 3.9651 3.035.8 3.149.5 3,139.4 2,116.9 2.179.5 2.143.7 918 9 970. 19958 8338 846 3 8257 29.7 813 80.8 7541 765.1 744,8 10,077.9 10.443 5 10.168.6 2,359.0 2586 2 2.375.9 4,638 4 4.667.1 4.658.5 2.298.9 2.310.7 2 3124 3160 3166 315.2 1,982.9 1.994.1 1.997.2 2.339.5 2356.4 2.346.1 352.6 355 9 3540 102.7 1029 1027 403 4 407 5 406.1 1,480.9 1.490.1 1.4833 1.6040 1.606.5 1,613.6 850.6 850.7 859.1 753 4 79.7 754.5 455.5 4579 457.3 29792978 2972 1,476.4 1.583.8 1.520.6 585.7 609.1 890.7 941.5 9115 1126 1149 1128 14,392.7 14,706 2 39782 4 0434 3.155.8 3,180.7 2.166.0 2.215.1 9897 965.5 2258628 80.5 81.1 7420 781.6 10.414.5 10,662.7 2.551.0 2,739.3 4.633 4,6771 2.30952.3124 317.0 317.9 1.992.5 1.9945 23538 2,364.7 355.6 3579 102.7 103.1 4076 4080 1.4879 1.495.7 1.613 5 1.6029 8575 8122 831 799.1 10.758.1 2.845.1 4.6822 23128 3174 1.995.4 2.3694 1031 1002 3799 3825 1.498 4 1.549.1 833.1 3628 1,402.9 1520.7 8160 7047 4289 275.8 1,386,0 457.9 2980 1.586.7 637.7 949. 1 1129 458.9 298 2 1.6434 6743 969.1 113.2 2978 1.6416 6790 9625 1228 8670 111. 1 Page 3 Assets and Liabilities of Commercial Banks in the United States Seasonally adjusted, billions of dollars (continued April 10, 2020 2019 Account 2019 Mar 2019 Sep 2019 Oct 2019 Nov 2020 Jan 2020 Feb 2020 Mar M ar 11 M 18 Mar 25 Apr 1 2.734.3 659.8 30 31 32 33 ASSETS CONTINUED) Cash assets Total federal funds sold and reverse RPS" Loans to commercial banks Other assets including trading assets TOTAL ASSETS 1.806.5 733.7 16.4 1.420.3 17,140.8 1629.4 797.5 2 8. 1.4871 17.504.7 1,674.3 794. 3 7 .5 1.486.3 17.582.6 1,698.7 7 78.1 7.6 1.482.1 17,661.4 1,781.3 759.0 8.0 1.493. 9 17,778.3 1.771.5 777.0 7.1 1 5186 17.834.3 1.746.0 809. 2 7.0 1559.2 17.956.3 2.185.4 7 69. 6 7.5 1.6951 18.981.9 1,804. 1 8 61.8 74 1.675.2 18,369.5 2.032.7 758.6 75 1.745.0 18,823.5 2.490.8 710.8 78 1.696.2 19.498.5 1.711.3 19.775.8 1 37 38 LIABILITIES Deposits Large time deposits Other deposits Borrowings Net due to related foreign offices Other abilities including trading able TOTAL LIABILITIES RESIDUAL (ASSETS LESS LIABILITIES) 12.574.2 1.778.1 10.796.1 1.9656 536 5013 15,104.7 1,956.1 12.965.7 13,066,0 1.811.7 1,831,0 11.154,0 11,235,0 1995.8 1,962,3 62 5 74, 6 64066442 15,599.7 15,618,0 1.949 1,9646 13,183.2 1,849.8 11,333.5 1,982.1 1138 646.7 15,698.1 1,963.2 13.239.6 1.8658 11.373.8 1.985.4 -993 6523 15,778.1 2,000.2 13.303.8 1854. 5 11449.2 1.967.5 131.1 4 15,809.6 2,024.7 13.384.7 .848.4 11.536.3 1.977.7 141,5 7142 15.995.1 2.021.2 13.8590 1.791.4 12.067,6 2.223.0 9. 9 830.5 16,931.3 2,050.6 13,500.1 1,818.4 11,681.7 2.079.7 84,1 802. 1 16,297,9 2,0716 13,7975 1,783.4 12.014.1 2.217.5 88. 5 3648 16,791.3 2,032,3 14.140.3 1.754.4 12.386.0 2.365.8 50. 6 902.6 17459.4 2,039.2 14.280.8 1.793.4 12.487.5 2,359.0 258.1 8242 17.722.2 2,053.7 40 41 42 MEMORANDA Net unrealized gains losses) on available for sale securities U.S. Treasury and agency securities, MBS - 14. 1 114 20. 8 152 19.9 144 18. 3 134 16.3 11.8 24. 1 174 36. 4 25.5 44.9 36.5 52. 3 375 26 3 219 408 38.7 55.1 47.7 Footnotes appear on the last page


