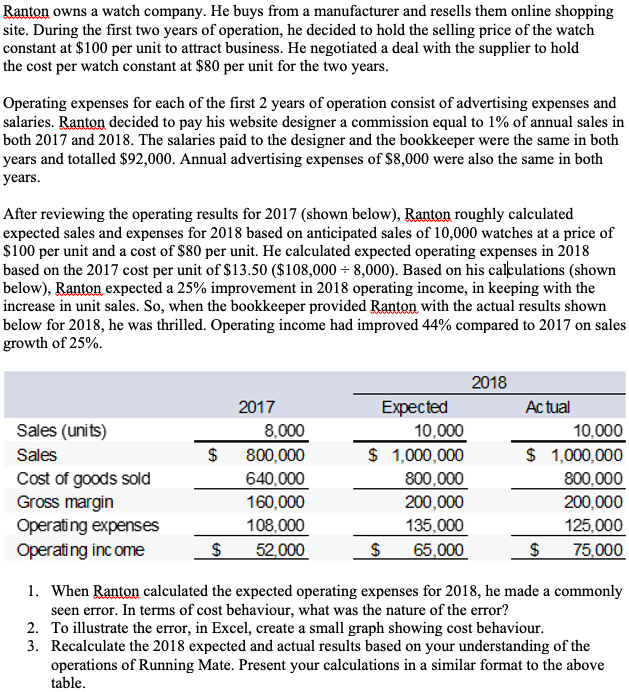
Ranton owns a watch company. He buys from a manufacturer and resells them online shopping site. During the first two years of operation, he decided to hold the selling price of the watch constant at $100 per unit to attract business. He negotiated a deal with the supplier to hold the cost per watch constant at $80 per unit for the two years. Operating expenses for each of the first 2 years of operation consist of advertising expenses and salaries. Ranton decided to pay his website designer a commission equal to 1% of annual sales in both 2017 and 2018. The salaries paid to the designer and the bookkeeper were the same in both years and totalled $92,000. Annual advertising expenses of $8,000 were also the same in both years. After reviewing the operating results for 2017 (shown below), Ranton roughly calculated expected sales and expenses for 2018 based on anticipated sales of 10,000 watches at a price of $100 per unit and a cost of $80 per unit. He calculated expected operating expenses in 2018 based on the 2017 cost per unit of $13.50 ($108,000 = 8,000). Based on his calculations (shown below), Ranton expected a 25% improvement in 2018 operating income, in keeping with the increase in unit sales. So, when the bookkeeper provided Ranton with the actual results shown below for 2018, he was thrilled. Operating income had improved 44% compared to 2017 on sales growth of 25%. $ Sales (units) Sales Cost of goods sold Gross margin Operating expenses Operating income 2017 8,000 800,000 640,000 160,000 108,000 52,000 2018 Expected 10,000 $ 1,000,000 800,000 200,000 135,000 $ 65,000 Actual 10,000 $ 1,000,000 800,000 200,000 125,000 $ 75,000 $ 1. When Ranton calculated the expected operating expenses for 2018, he made a commonly seen error. In terms of cost behaviour, what was the nature of the error? 2. To illustrate the error, in Excel, create a small graph showing cost behaviour. 3. Recalculate the 2018 expected and actual results based on your understanding of the operations of Running Mate. Present your calculations in a similar format to the above table. Ranton owns a watch company. He buys from a manufacturer and resells them online shopping site. During the first two years of operation, he decided to hold the selling price of the watch constant at $100 per unit to attract business. He negotiated a deal with the supplier to hold the cost per watch constant at $80 per unit for the two years. Operating expenses for each of the first 2 years of operation consist of advertising expenses and salaries. Ranton decided to pay his website designer a commission equal to 1% of annual sales in both 2017 and 2018. The salaries paid to the designer and the bookkeeper were the same in both years and totalled $92,000. Annual advertising expenses of $8,000 were also the same in both years. After reviewing the operating results for 2017 (shown below), Ranton roughly calculated expected sales and expenses for 2018 based on anticipated sales of 10,000 watches at a price of $100 per unit and a cost of $80 per unit. He calculated expected operating expenses in 2018 based on the 2017 cost per unit of $13.50 ($108,000 = 8,000). Based on his calculations (shown below), Ranton expected a 25% improvement in 2018 operating income, in keeping with the increase in unit sales. So, when the bookkeeper provided Ranton with the actual results shown below for 2018, he was thrilled. Operating income had improved 44% compared to 2017 on sales growth of 25%. $ Sales (units) Sales Cost of goods sold Gross margin Operating expenses Operating income 2017 8,000 800,000 640,000 160,000 108,000 52,000 2018 Expected 10,000 $ 1,000,000 800,000 200,000 135,000 $ 65,000 Actual 10,000 $ 1,000,000 800,000 200,000 125,000 $ 75,000 $ 1. When Ranton calculated the expected operating expenses for 2018, he made a commonly seen error. In terms of cost behaviour, what was the nature of the error? 2. To illustrate the error, in Excel, create a small graph showing cost behaviour. 3. Recalculate the 2018 expected and actual results based on your understanding of the operations of Running Mate. Present your calculations in a similar format to the above table


