Answered step by step
Verified Expert Solution
Link Copied!

Question

1 Approved Answer

RATIO ANALYSIS Item Name Formula Company Data Used Answer 5. Debt-to-Total-Assets Ratio Total Liabilities / Total Assets 6. Debt-to-Equity Ratio Total Liabilities / Total Equity

image text in transcribedimage text in transcribed

RATIO ANALYSIS
Item Name Formula Company Data Used Answer
5. Debt-to-Total-Assets Ratio Total Liabilities / Total Assets
6. Debt-to-Equity Ratio Total Liabilities / Total Equity
7. Negative Net Income (Net Loss)? (Yes/No)
8. Negative Retained Earnings? (Yes/No)
9. Audit report: Who were the auditors? (Yes/No)
10. Audit report: What was the audit opinion? (Yes/No)
11. Audit report: Was there a going concern issue? (Yes/No)
12. Audit report: Any other serious issues? If yes, list the other concerns auditors had about the company's financial statements (Yes/No)
Fujairah Building Industries P.J.S.C. and its subsidiaries Consolidated statement of profit or loss and other comprehensive income for the year ended 31 December 2019 2019 AED 2018 AED Note Continuing operations Revenue Cost of sales 6 7 218,566,074 248,242,298 (125,019,569) (151,085,076) Gross profit 93,546,505 97,157,222 Administrative and general expenses Selling and distribution expenses Impairment loss on trade receivables Other income 8 9 32(a) 10 (25,063,165) (21,305,009) (1,075,421) 2,768,801 (26,218,462) (27,499,188) (738,449) 4,877,100 Operating profit 48,871,711 47,578,223 Finance costs Finance income Dividend income 11 11 14 (ii) (5,209,312) 2,079,231 1,583,241 (1,959,440) 651,973 985,107 Profit from continuing operations 47,324,871 47,255,863 Profit/(loss) from discontinued operation 33 22,680 (782,821) Profit for the year 47,347,551 46,473,042 Profit attributable to: Owners of the Company Non-controlling interests 47,347,551 46,473,042 Profit for the year 47,347,551 46,473,042 Fujairah Building Industries P.J.S.C. and its subsidiaries Consolidated statement of financial position as at 31 December 2019 2019 AED 2018 AED Note Assets Non-current assets Property, plant and equipment Long term receivables Investments carried at fair value through other comprehensive income (FVOCI) 12 13 210,209,489 596,204 163,428,329 570,419 14 53,797,089 57,422,109 264,602,782 221,420,857 Current assets Investments carried at fair value through other comprehensive income (FVOCI) Inventories Trade receivables Advances, deposits and other receivables Contract assets Fixed deposits Cash in hand and at banks 14 15 16 17 18 19 20 45,125,169 44,793,522 5,780,116 1,446,453 53,000,000 63,737,383 559,543 35,901,401 55,849,676 9,681,835 1,020,170 37,000,000 26,235,964 213,882,643 166,248,589 Total assets 478,485,425 387,669,446 Equity Share capital Statutory reserve Fair value reserve of investments carried at FVOCI Retained earnings 21 22 23 24 135,987,500 41,779,954 47,393,860 118,977,873 135,987,500 37,045,199 39,772,179 88,472,086 344,139,187 301,276,964 21,333,333 Non-current liabilities Bank borrowings Lease liabilities Employees' end of service benefits 25 26 27 14,222,222 60,774,816 10,188,586 12,056,535 85,185,624 33,389,868 7,823,153 Current liabilities Bank borrowings Lease liabilities Trade and other payables 25 26 28 7,111,111 4,382,098 37,667,405 45,179,461 49,160,614 53,002,614 Total liabilities 134,346,238 86,392,482 Total equity and liabilities 478,485,425 387,669,446

Step by Step Solution

There are 3 Steps involved in it

Step: 1

blur-text-image

Get Instant Access to Expert-Tailored Solutions

See step-by-step solutions with expert insights and AI powered tools for academic success

Step: 2

blur-text-image

Step: 3

blur-text-image

Ace Your Homework with AI

Get the answers you need in no time with our AI-driven, step-by-step assistance

Get Started

Recommended Textbook for

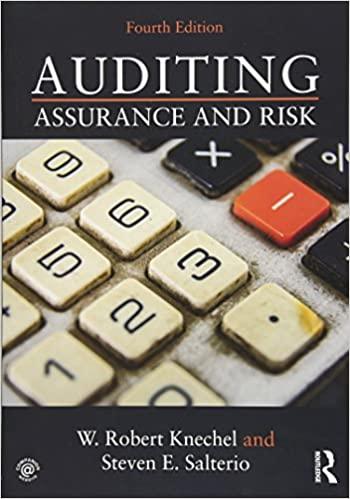
Auditing Assurance And Risk

Authors: W Robert Knechel, Steven E Salterio

4th Edition

1315531720, 9781315531724

More Books

Students also viewed these Accounting questions

Question

7.9 Determine how the final hiring decision is made.

Answered: 1 week ago