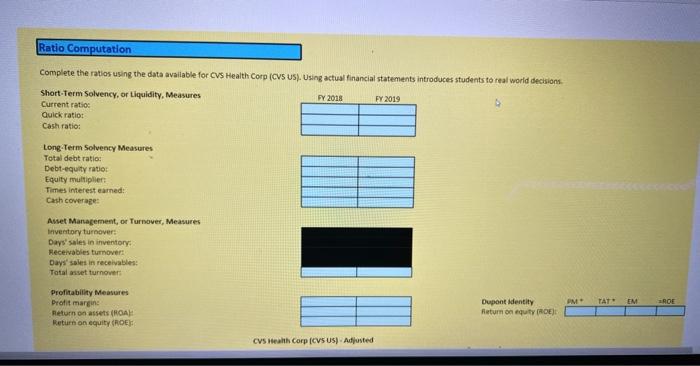
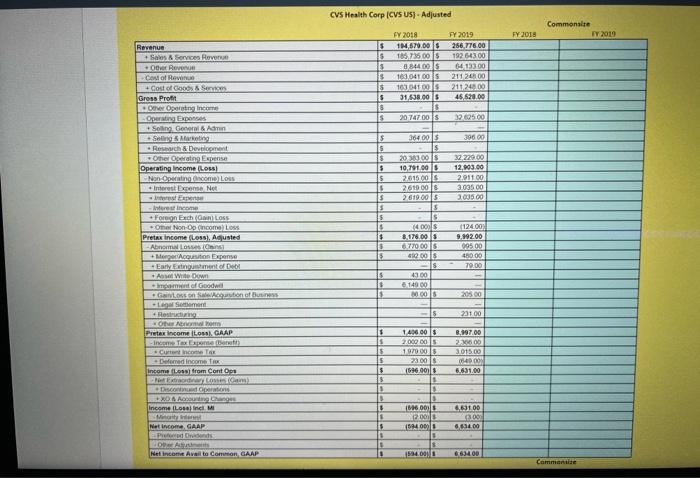
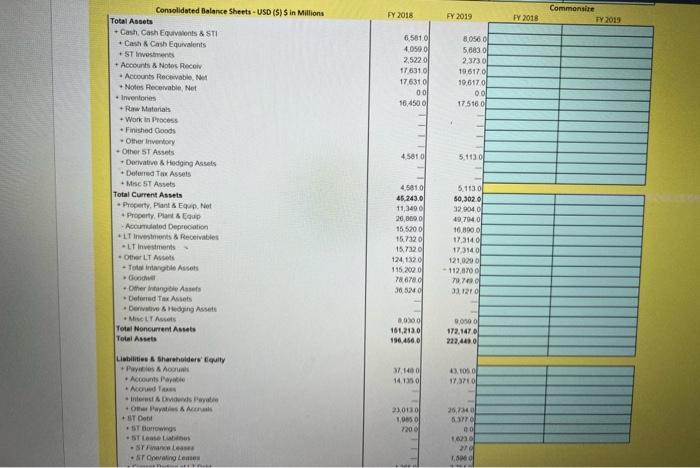
Ratio Computation Complete the ratios using the data available for CVS Health Corp (CVS US). Using actual financial statements introduces students to real world decisions Short-Term Solvency, or Liquidity, Measures FY 2015 FY 2019 Current ratio: Quick ratio Cash ratio: Long Term Solvency Measures Total debt ratio: Debt-equity ratio Equity multiplier Times interest earned: Cash coverage Asset Management, or Turnover, Measures Inventory turnovert Days' sales in inventory: Receivables turnover Days' sales in receivables: Total asset turnover PM TAT EM ROE Profitability Measures Drofit margin Return on assets(ROA Return on equity CROE Dupont identity Return on equity (ROE) CVS Health Corp (CVSUS) Adjusted CVS Health Corp (CVS US) - Adjusted Commonsi FY 2010 FY 2018 S 15 FY 2018 1 570.00 1657350015 8 844 00 15 163041005 163 04100 31.538.00 5 20 74700 S FY 2019 256 776.00 192 64300 0413300 211 21.00 211.248 00 45,520.00 s S 5 8 S 32.605.00 39000 Revenue + Sales & Services Rover OR Covo R Cost of Gooes Set Gross Prett Omer Operating Income Ora + Song An Songs Research & Develcoment Otherwing Operating income (LOS) Non Opticom Lous Interest Essom Not E income Foreign Excha LOSS Omat Non-Op income LOSS Pretax income (Loss). As usted Abnormal losses + Mere Acquisition Expense Early Enguanto Do Alte Down Goodwi Genel legalment Restructuring Olenom Pretax income Los GAAP Inam Cuenca - Defamed Income Tax Income fons from Contops 5 IS $ 5 5 15 S 15 5 32220.00 12,493.00 2011 00 3.035 00 2.095.00 364005 5 2015 10741.00 2015 00 15 2610.000 2.619.005 5 S 1400 8.178.00 S 770.000 80.00 15 S 43 00 149 00 M005 $ 16 (12400 9.192.00 095.00 450.00 79.00 S 6 20500 IS 23100 1406.00 $ 2.000.00 1970 00 15 23001 1596.000 8,197.00 2600 3.015.00 6.691.00 s Descoperto +XOA Agus Income Losinci M . Nat income GAAP Pens OBA Net Income Avail to Common GAAP 15 $ $ 1 13 6 . Is . 1860 200 15940 6.631.00 300 0.634.00 594.000 663400 Commande FY 2018 FY 2019 FY 2018 Commonsi FY2019 6.5810 4000 2.5220 176310 176310 0.0 16,4500 B0560 5,683 0 23730 196170 10 5170 00 17516 01 4.5010 5.1130 Consolidated Balance Sheets - USD (5) Sin Millions Total Assets Cash Cash Equivalents & STI Cash & Cash Equivalents ST Investments - Accounts & Notes Recoi Accounts Receivable Notes Receivable Net Inventories Raw Materials Work in Process Finished Goods - Other Inventory - Other ST Assets Derivative & Hedging Assets Deferred Tax Assets + Mc ST Assets Total Current Assets Property Plant EwNet Property. Plant & Equip -Acourted Depreciation IT Investments & Receivables .LT investments - Other LT A - Toge Assets Good Other inte se fred Tax Assets Die Hedging Assets ML Assets Total Noncurrent Assets Total Assets 4.5810 45.243.0 11,340 26,600 155200 157320 157320 124 1320 115.2000 78 365 5.1130 50,3020 929040 49.7440 10.800.0 17 3140 173140 121.0290 - 112,870 01 79.0c 31210 0.000 161.213.0 196.4500 BOS 172.147.0 222.4430 371400 14.135.0 43.00 17.5710 Liabilities & Shareholders' Equity +Pwls & A Accounts Pay ATA In Di Pote Pwy cena STO * 1ST in - STEL - ST STOg lesen 2013 1.000 7200 26,7340 0.37 00 03 20 . Ratio Computation Complete the ratios using the data available for CVS Health Corp (CVS US). Using actual financial statements introduces students to real world decisions Short-Term Solvency, or Liquidity, Measures FY 2015 FY 2019 Current ratio: Quick ratio Cash ratio: Long Term Solvency Measures Total debt ratio: Debt-equity ratio Equity multiplier Times interest earned: Cash coverage Asset Management, or Turnover, Measures Inventory turnovert Days' sales in inventory: Receivables turnover Days' sales in receivables: Total asset turnover PM TAT EM ROE Profitability Measures Drofit margin Return on assets(ROA Return on equity CROE Dupont identity Return on equity (ROE) CVS Health Corp (CVSUS) Adjusted CVS Health Corp (CVS US) - Adjusted Commonsi FY 2010 FY 2018 S 15 FY 2018 1 570.00 1657350015 8 844 00 15 163041005 163 04100 31.538.00 5 20 74700 S FY 2019 256 776.00 192 64300 0413300 211 21.00 211.248 00 45,520.00 s S 5 8 S 32.605.00 39000 Revenue + Sales & Services Rover OR Covo R Cost of Gooes Set Gross Prett Omer Operating Income Ora + Song An Songs Research & Develcoment Otherwing Operating income (LOS) Non Opticom Lous Interest Essom Not E income Foreign Excha LOSS Omat Non-Op income LOSS Pretax income (Loss). As usted Abnormal losses + Mere Acquisition Expense Early Enguanto Do Alte Down Goodwi Genel legalment Restructuring Olenom Pretax income Los GAAP Inam Cuenca - Defamed Income Tax Income fons from Contops 5 IS $ 5 5 15 S 15 5 32220.00 12,493.00 2011 00 3.035 00 2.095.00 364005 5 2015 10741.00 2015 00 15 2610.000 2.619.005 5 S 1400 8.178.00 S 770.000 80.00 15 S 43 00 149 00 M005 $ 16 (12400 9.192.00 095.00 450.00 79.00 S 6 20500 IS 23100 1406.00 $ 2.000.00 1970 00 15 23001 1596.000 8,197.00 2600 3.015.00 6.691.00 s Descoperto +XOA Agus Income Losinci M . Nat income GAAP Pens OBA Net Income Avail to Common GAAP 15 $ $ 1 13 6 . Is . 1860 200 15940 6.631.00 300 0.634.00 594.000 663400 Commande FY 2018 FY 2019 FY 2018 Commonsi FY2019 6.5810 4000 2.5220 176310 176310 0.0 16,4500 B0560 5,683 0 23730 196170 10 5170 00 17516 01 4.5010 5.1130 Consolidated Balance Sheets - USD (5) Sin Millions Total Assets Cash Cash Equivalents & STI Cash & Cash Equivalents ST Investments - Accounts & Notes Recoi Accounts Receivable Notes Receivable Net Inventories Raw Materials Work in Process Finished Goods - Other Inventory - Other ST Assets Derivative & Hedging Assets Deferred Tax Assets + Mc ST Assets Total Current Assets Property Plant EwNet Property. Plant & Equip -Acourted Depreciation IT Investments & Receivables .LT investments - Other LT A - Toge Assets Good Other inte se fred Tax Assets Die Hedging Assets ML Assets Total Noncurrent Assets Total Assets 4.5810 45.243.0 11,340 26,600 155200 157320 157320 124 1320 115.2000 78 365 5.1130 50,3020 929040 49.7440 10.800.0 17 3140 173140 121.0290 - 112,870 01 79.0c 31210 0.000 161.213.0 196.4500 BOS 172.147.0 222.4430 371400 14.135.0 43.00 17.5710 Liabilities & Shareholders' Equity +Pwls & A Accounts Pay ATA In Di Pote Pwy cena STO * 1ST in - STEL - ST STOg lesen 2013 1.000 7200 26,7340 0.37 00 03 20


