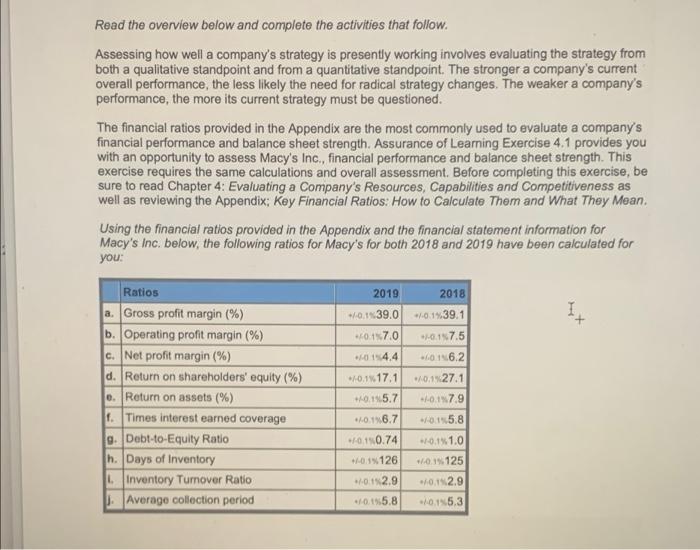
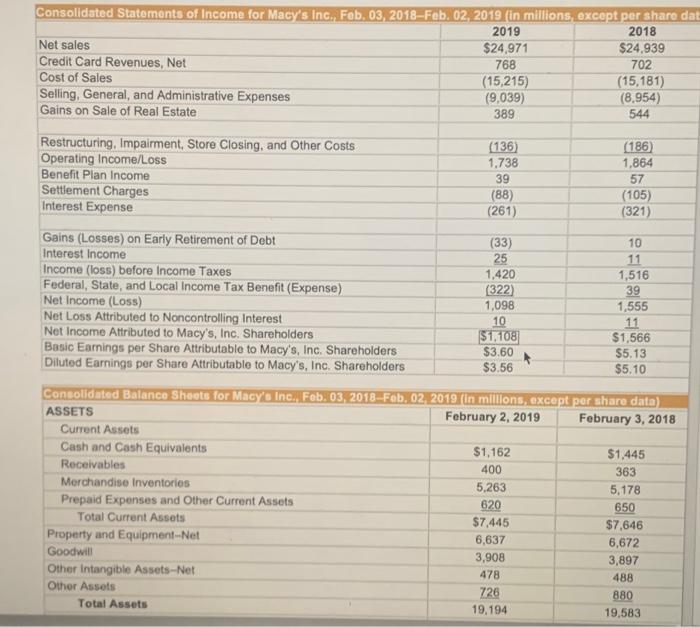
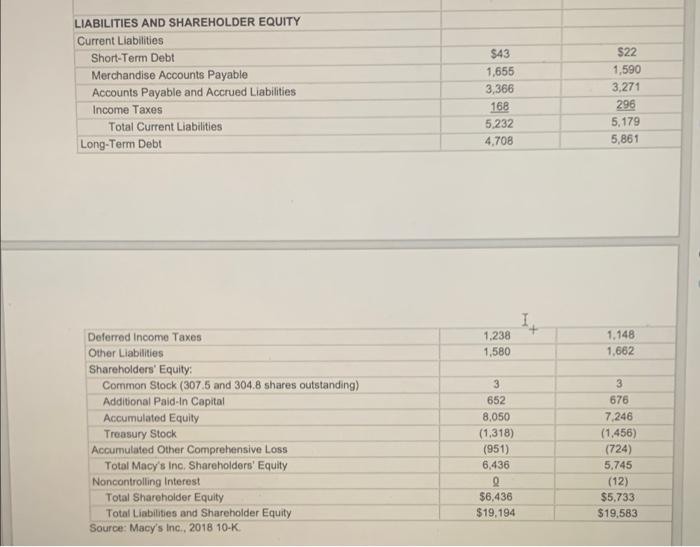
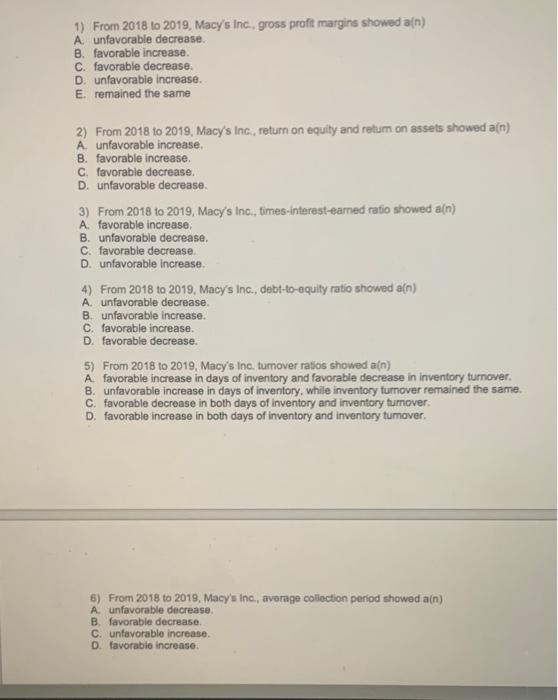
Read the overview below and complete the activities that follow. Assessing how well a company's strategy is presently working involves evaluating the strategy from both a qualitative standpoint and from a quantitative standpoint. The stronger a company's current overall performance, the less likely the need for radical strategy changes. The weaker a company's performance, the more its current strategy must be questioned. The financial ratios provided in the Appendix are the most commonly used to evaluate a company's financial performance and balance sheet strength. Assurance of Learning Exercise 4.1 provides you with an opportunity to assess Macy's Inc., financial performance and balance sheet strength. This exercise requires the same calculations and overall assessment. Before completing this exercise, be sure to read Chapter 4: Evaluating a Company's Resources, Capabilities and Competitiveness as well as reviewing the Appendix; Key Financial Ratios: How to Calculate them and What They Mean. Using the financial ratios provided in the Appendix and the financial statement information for Macy's Inc. below, the following ratios for Macy's for both 2018 and 2019 have been calculated for you: 2019 1.0.1439.0 2018 -0.139.1 -0.137.5 0.17.0 2014,4 6.0 16.2 Ratios a. Gross profit margin (%) b. Operating profit margin (%) c. Net profit margin (%) d. Return on shareholders' equity (%) e. Return on assets (%) 1. Times interest earned coverage g. Debt-to-Equity Ratio h. Days of Inventory L. Inventory Turnover Ratio Average collection period *-0.15 17.1 0.145.7 *0.127.1 -0.17.9 * 0.126.7 -0.15.8 -0.10.74 W.1126 +/-0.1% 1.0 01.125 -0.152.9 10.12.9 -0.155.8 0.15.3 Consolidated Statements of Income for Macy's Inc. Feb. 03, 2018-Feb. 02. 2019 in millions, except per share dat 2019 2018 Net sales $24.971 $24.939 Credit Card Revenues, Net 768 702 Cost of Sales (15,215) (15,181) Selling, General, and Administrative Expenses (9,039) (8.954) Gains on Sale of Real Estate 389 544 Restructuring, Impairment, Store Closing, and Other Costs Operating Income/Loss Benefit Plan Income Settlement Charges Interest Expense (136) 1,738 39 (88) (261) (186) 1,864 57 (105) (321) 39 Gains (Losses) on Early Retirement of Debt (33) 10 Interest Income 25 11 Income (loss) before Income Taxes 1,420 1,516 Federal, State, and Local Income Tax Benefit (Expense) (322) Net Income (Loss) 1,098 1,555 Net Loss Attributed to Noncontrolling Interest 10 11 Net Income Attributed to Macy's, Inc. Shareholders $1,108 $1,566 Basic Earnings per Share Attributable to Macy's, Inc. Shareholders $3.60 $5.13 Diluted Earnings per Share Attributable to Macy's, Inc. Shareholders $3.56 $5.10 Consolidated Balance Sheets for Macy's Inc. Feb. 03. 2018-Feb. 02. 2019 (in millions, except por share data) ASSETS February 2, 2019 February 3, 2018 Current Assets Cash and Cash Equivalents $1,162 $1,445 Receivables 400 363 Merchandise Inventories 5.263 5,178 Prepaid Expenses and Other Current Assets 620 650 Total Current Assets $7,445 $7,646 Property and Equipment--Net 6,637 6,672 Goodwill 3,908 3,897 Other Intangible Assets-Net 478 488 Other Assets 726 880 Total Assets 19.194 19,583 LIABILITIES AND SHAREHOLDER EQUITY Current Liabilities Short-Term Debt Merchandise Accounts Payable Accounts Payable and Accrued Liabilities Income Taxes Total Current Liabilities Long-Term Debt $43 1,655 3,366 168 5.232 4.708 S22 1,590 3,271 296 5,179 5,861 1.238 1,580 1,148 1,662 Deferred Income Taxes Other Liabilities Shareholders' Equity: Common Stock (307.5 and 304.8 shares outstanding) Additional Paid in Capital Accumulated Equity Treasury Stock Accumulated Other Comprehensive Loss Total Macy's Inc, Shareholders' Equity Noncontrolling Interest Total Shareholder Equity Total Liabilities and Shareholder Equity Source: Macy's Inc., 2018 10-K 3 652 8,050 (1,318) (951) 6,436 3 676 7.246 (1.456) (724) 5.745 (12) $5.733 $19,583 $6,436 $19,194 1) From 2018 to 2019, Macy's Inc., gross proft margins showed a(n) A unfavorable decrease B. favorable increase C. favorable decrease. D. unfavorabie increase E. remained the same 2) From 2018 to 2019, Macy's Inc., return on equity and retum on assets showed a(n) A. unfavorable increase B. favorable increase c. favorable decrease. D. unfavorable decrease. 3) From 2018 to 2019, Macy's Inc., times-interest-earned ratio showed a(n) A favorable increase B. unfavorable decrease. C. favorable decrease D. unfavorable Increase 4) From 2018 to 2019, Macy's Inc., debt-to-equity ratio showed a(n) A unfavorable decrease B. unfavorable increase. C. favorable increase D. favorable decrease. 5) From 2018 to 2019, Macy's Inc. turnover ratios showed a(n) A favorable increase in days of inventory and favorable decrease in inventory turnover. B. unfavorable increase in days of inventory, while inventory tumover remained the same. C favorable decrease in both days of inventory and inventory tumover D. favorable increase in both days of inventory and inventory tumover. 6) From 2018 to 2019, Macy's Inc., average collection period showed a(n) A unfavorable decrease. B. favorable decrease. c. unfavorable increase D. favorablo Increase