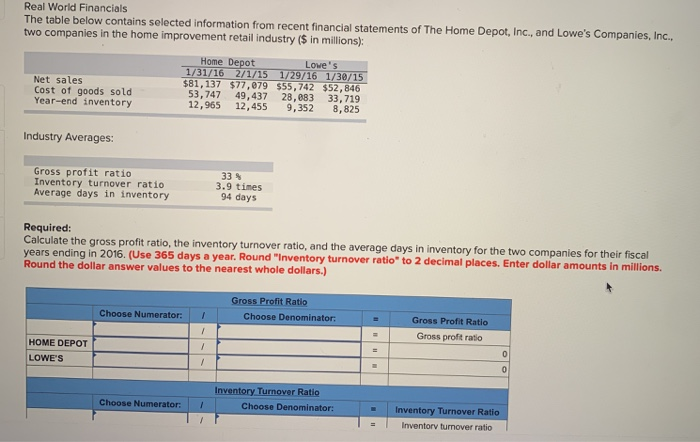
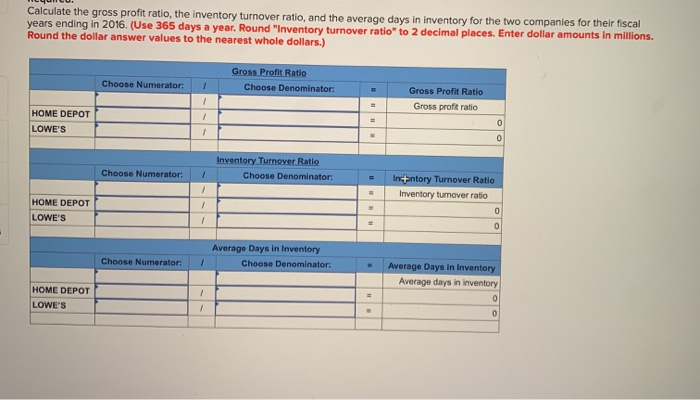
Real World Financials The table below contains selected information from recent financial statements of The Home Depot, Inc., and Lowe's Companies, Inc., two companies in the home improvement retail industry ($ in millions): Net sales Cost of goods sold Year-end inventory Home Depot Love's 1/31/16 2/1/15 1/29/16 1/30/15 $81, 137 $77,079 $55, 742 $52,846 53, 747 49,437 28,883 33,719 12,965 12,455 9,352 8,825 Industry Averages Gross profit ratio Inventory turnover ratio Average days in inventory 33 3.9 times 94 days Required: Calculate the gross profit ratio, the inventory turnover ratio, and the average days in inventory for the two companies for their fiscal years ending in 2016. (Use 365 days a year. Round "Inventory turnover ratio" to 2 decimal places. Enter dollar amounts in millions. Round the dollar answer values to the nearest whole dollars.) Choose Numerator: Gross Profit Ratio Choose Denominator: E Gross Profit Ratio Gross proftratio = HOME DEPOT LOWE'S 0 0 Choose Numerator: Inventory Turnover Ratio Choose Denominator: Inventory Turnover Ratio Inventorv turnover ratio Calculate the gross profit ratio, the inventory turnover ratio, and the average days in inventory for the two companies for their fiscal years ending in 2016. (Use 365 days a year. Round "Inventory turnover ratio" to 2 decimal places. Enter dollar amounts in millions. Round the dollar answer values to the nearest whole dollars.) Choose Numerator: Gross Profit Ratio Choose Denominator: 1 Gross Profit Ratio Gross profit ratio HOME DEPOT LOWE'S 1 0 0 Choose Numerator: Inventory Turnover Ratio Choose Denominator: In-ntory Turnover Ratio Inventory turnover ratio 0 HOME DEPOT LOWE'S 0 Choose Numerator: Average Days in Inventory Choose Denominator: Average Days in Inventory Average days in Inventory 0 1 HOME DEPOT LOWES 1 0