

Answered step by step
Verified Expert Solution
Question
1 Approved Answer
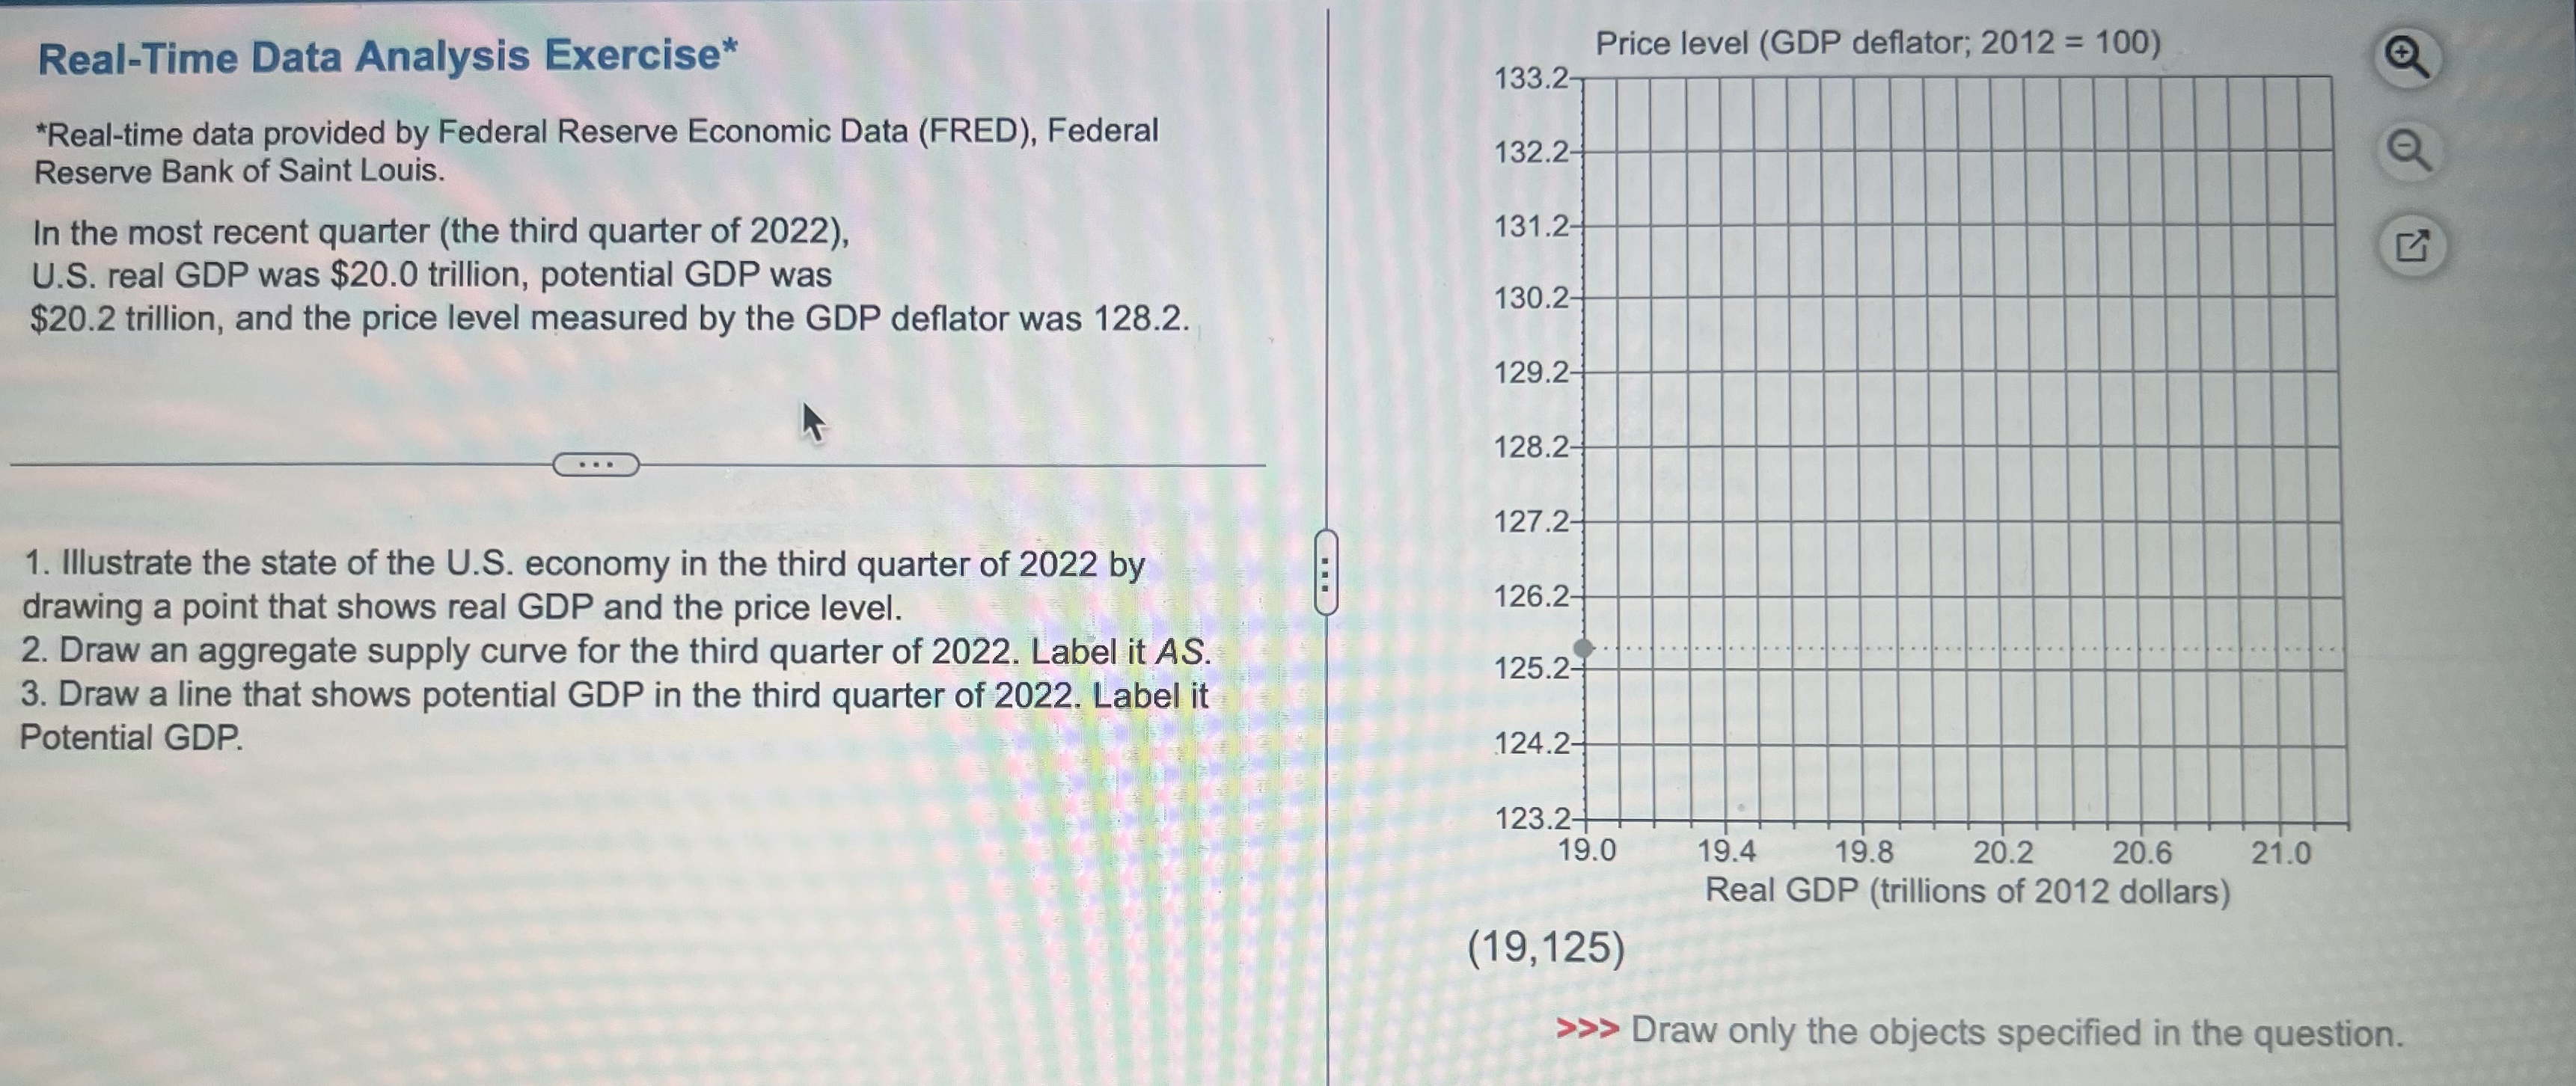
Real-Time Data Analysis Exercise* Price level (GDP deflator; 2012 = 100) + 133.2 *Real-time data provided by Federal Reserve Economic Data (FRED), Federal 132.2- Reserve
Step by Step Solution
There are 3 Steps involved in it
Step: 1

Get Instant Access to Expert-Tailored Solutions
See step-by-step solutions with expert insights and AI powered tools for academic success
Step: 2

Step: 3
Ace Your Homework with AI
Get the answers you need in no time with our AI-driven, step-by-step assistance
Get Started
Microeconomics Principles, Problems, And Policies
Authors: Campbell McConnell
21st Edition
1259915727, 9781259915727