Answered step by step
Verified Expert Solution
Link Copied!

Question

1 Approved Answer

Recall a figure from the lectures on the composition of the federal government's revenues by source in FY 2019. The following diagram presents a version
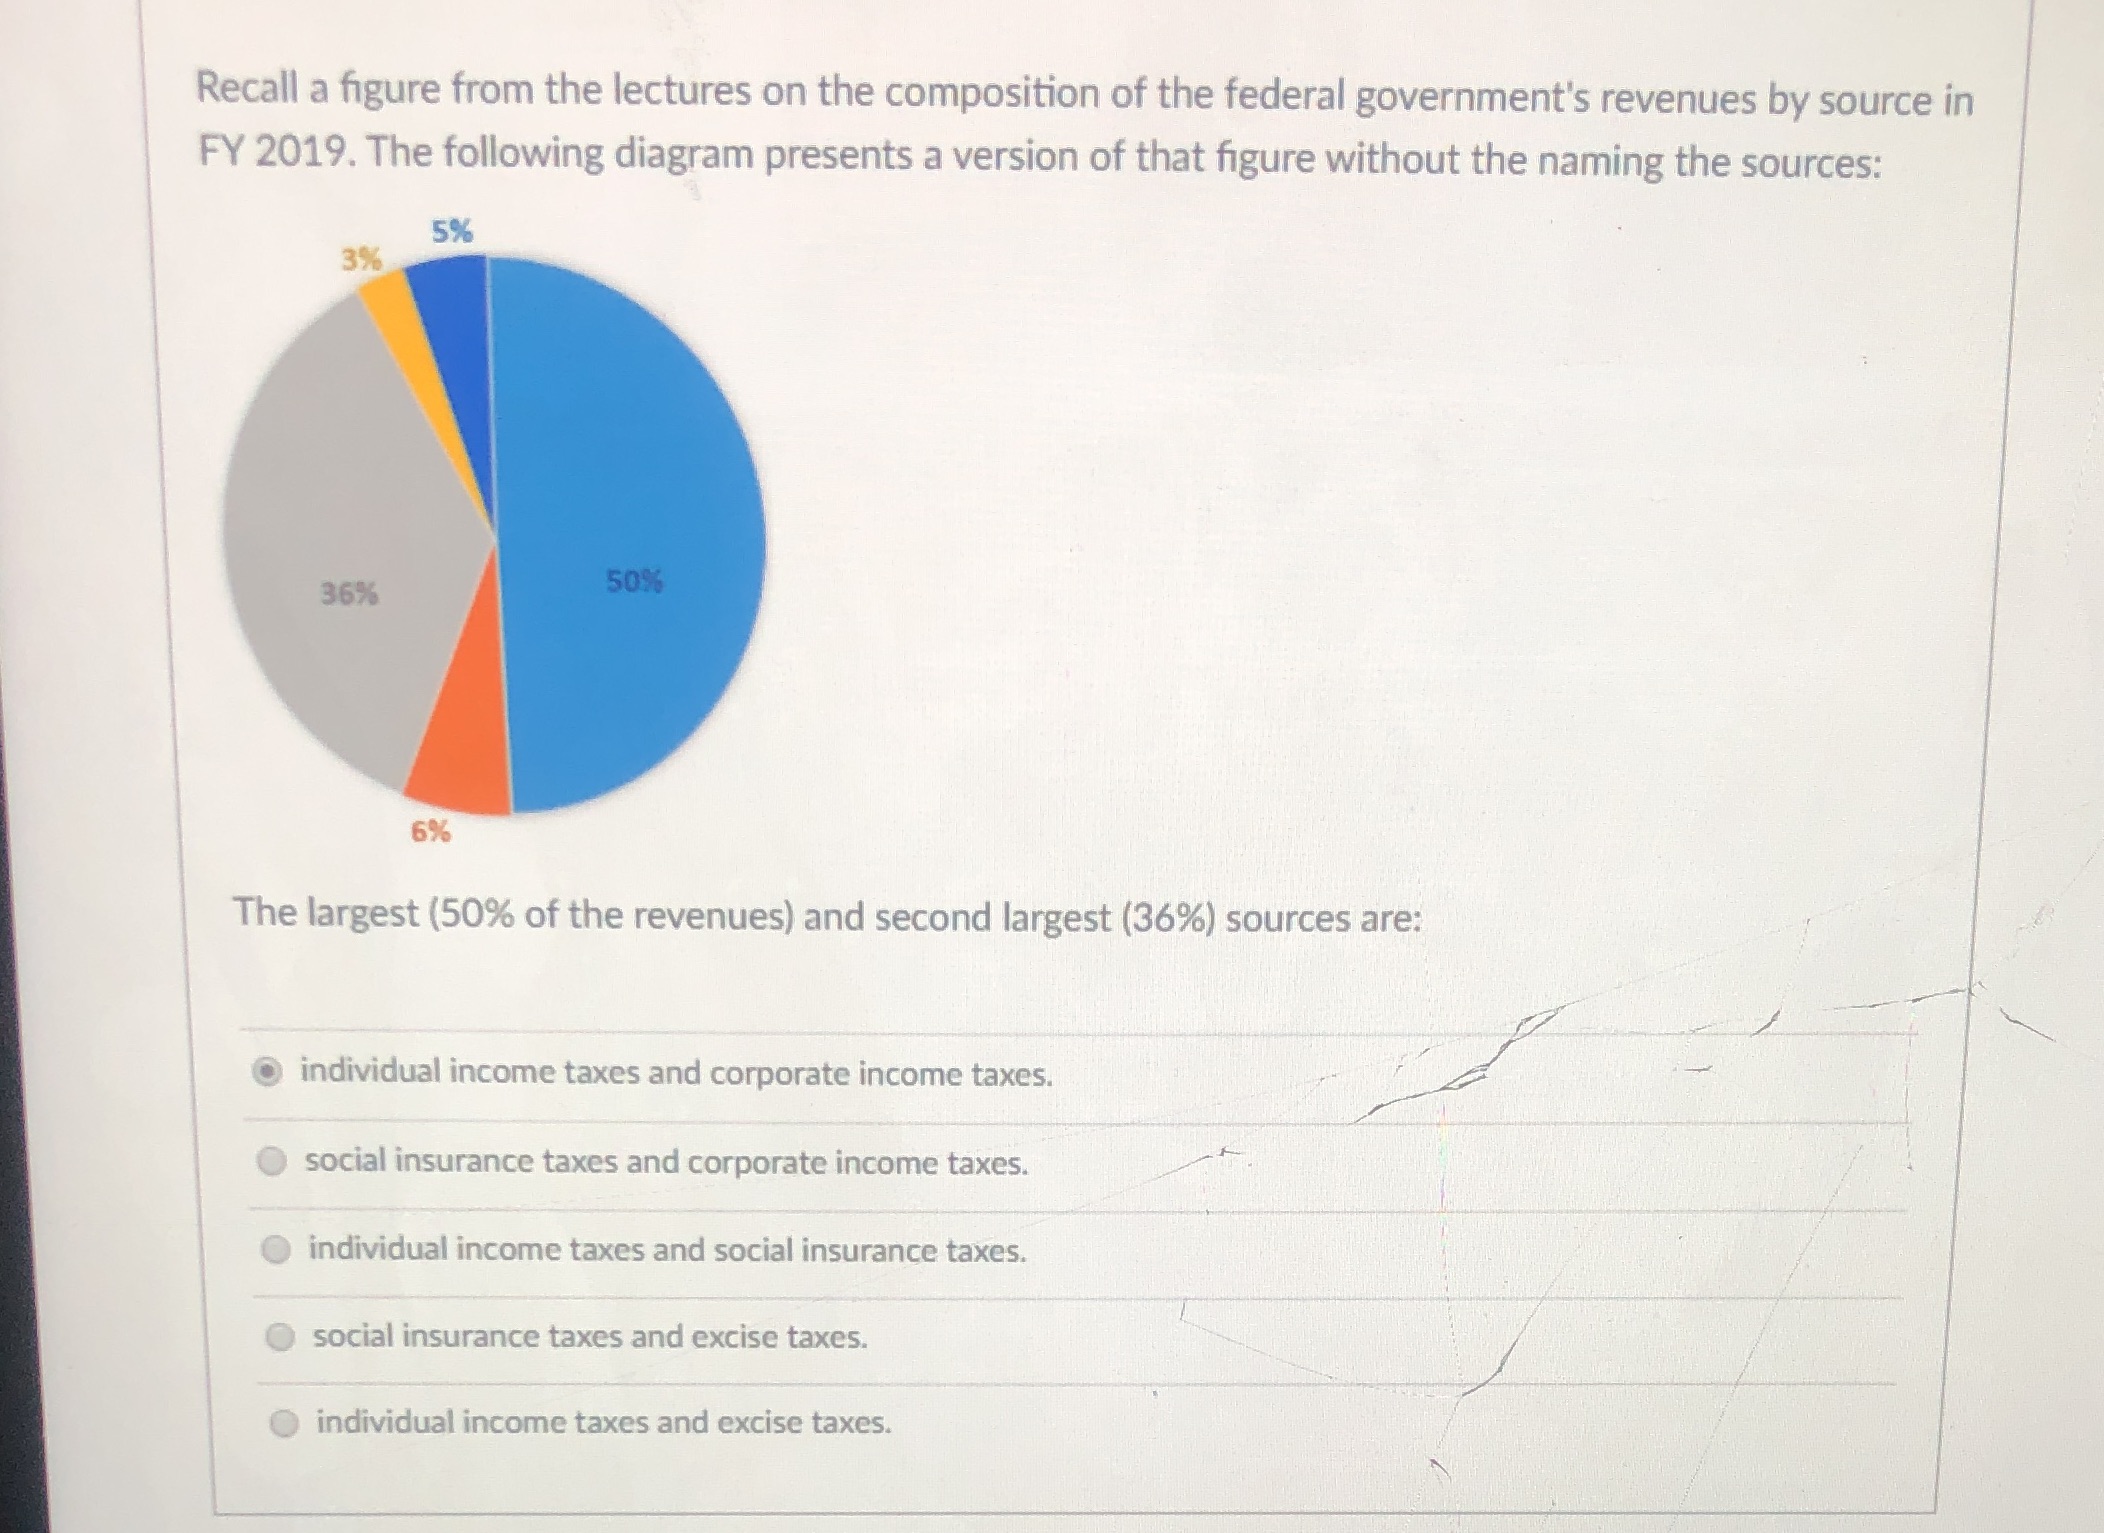
image text in transcribed
Recall a figure from the lectures on the composition of the federal government's revenues by source in FY 2019. The following diagram presents a version of that figure without the naming the sources: 5% 3% 36% 50% 6% The largest (50% of the revenues) and second largest (36%) sources are: individual income taxes and corporate income taxes. social insurance taxes and corporate income taxes. individual income taxes and social insurance taxes. social insurance taxes and excise taxes. individual income taxes and excise taxes

Step by Step Solution

There are 3 Steps involved in it

Step: 1

blur-text-image

Get Instant Access to Expert-Tailored Solutions

See step-by-step solutions with expert insights and AI powered tools for academic success

Step: 2

blur-text-image

Step: 3

blur-text-image

Ace Your Homework with AI

Get the answers you need in no time with our AI-driven, step-by-step assistance

Get Started

Recommended Textbook for

Managerial Economics A Problem-Solving Approach

Authors: Luke M. Froeb, Brain T. Mccann

2nd Edition

B00BTM8FK0

More Books

Students also viewed these Economics questions

Question

14. What is concurrent engineering, and why is it important?

Answered: 1 week ago

Question

=+ b. What is the per-worker production function, y = f(k)?

Answered: 1 week ago