Answered step by step
Verified Expert Solution
Question
1 Approved Answer
Recommend whether you should invest in Sims Metal Management Limited or Bluescope Steel Limited or alternatively reject both offers. Justify the recommendation based on the
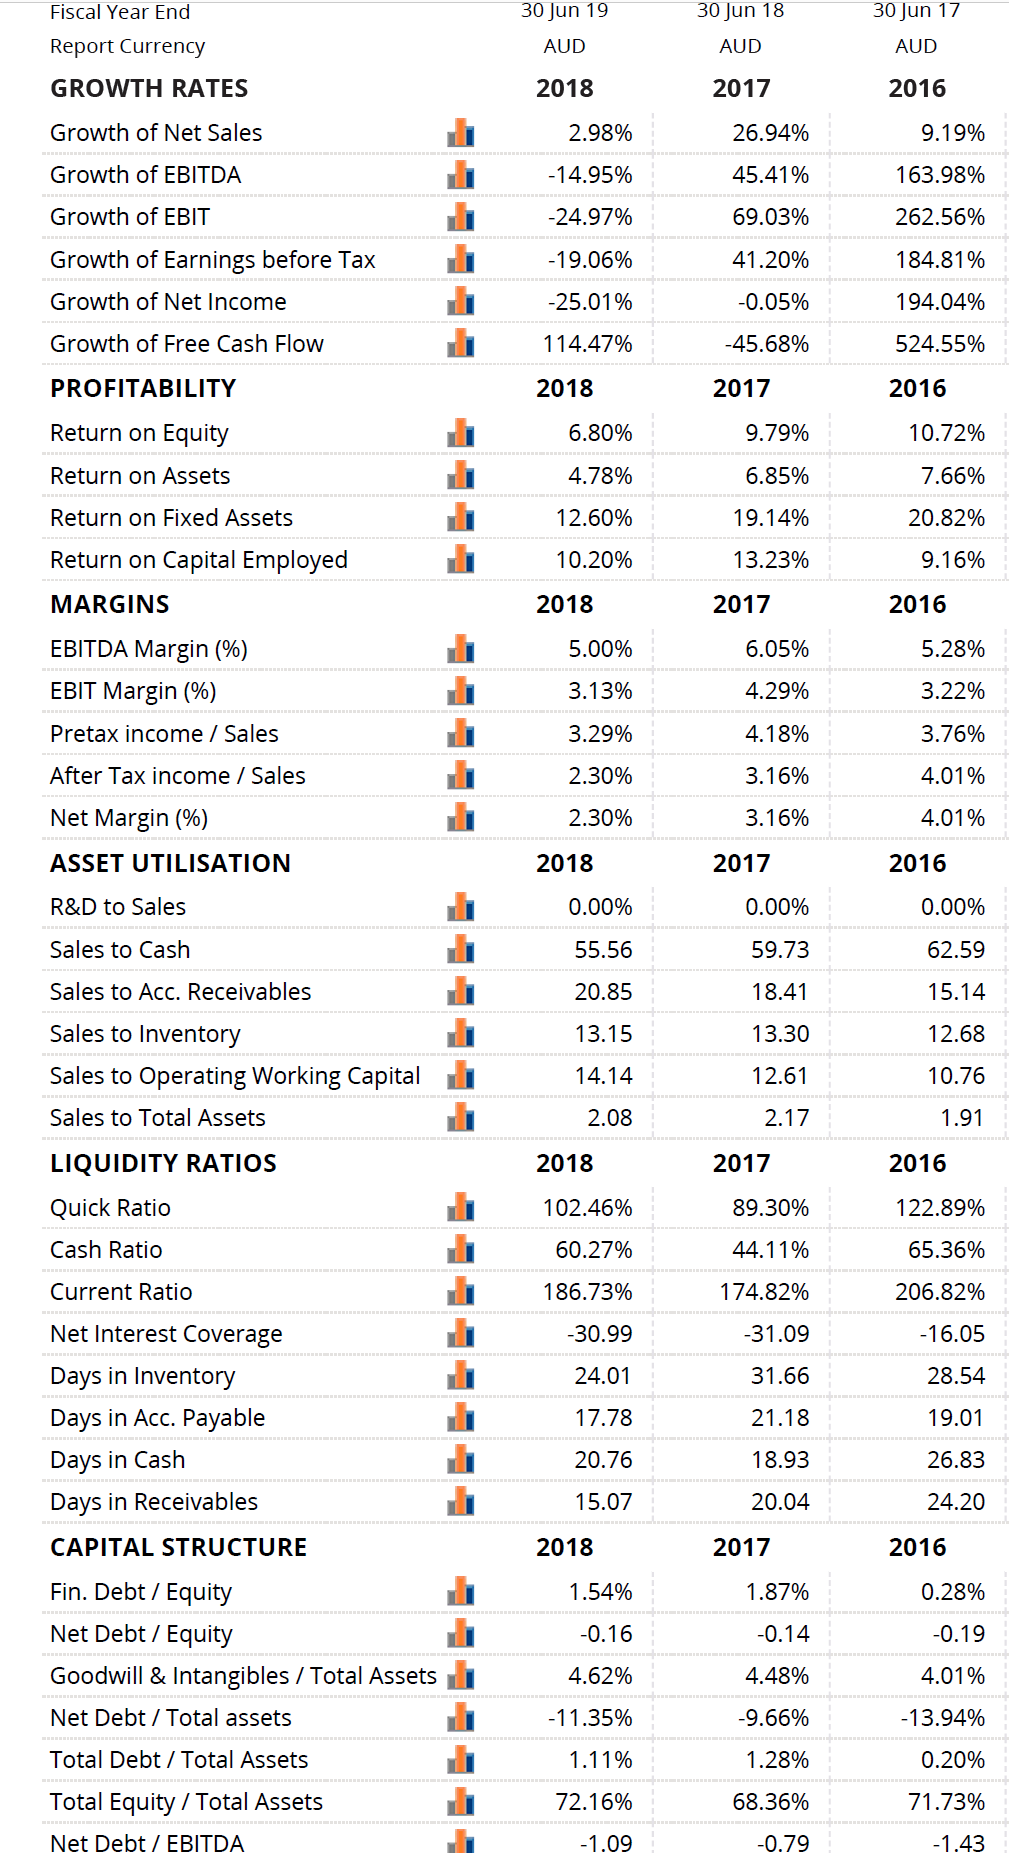
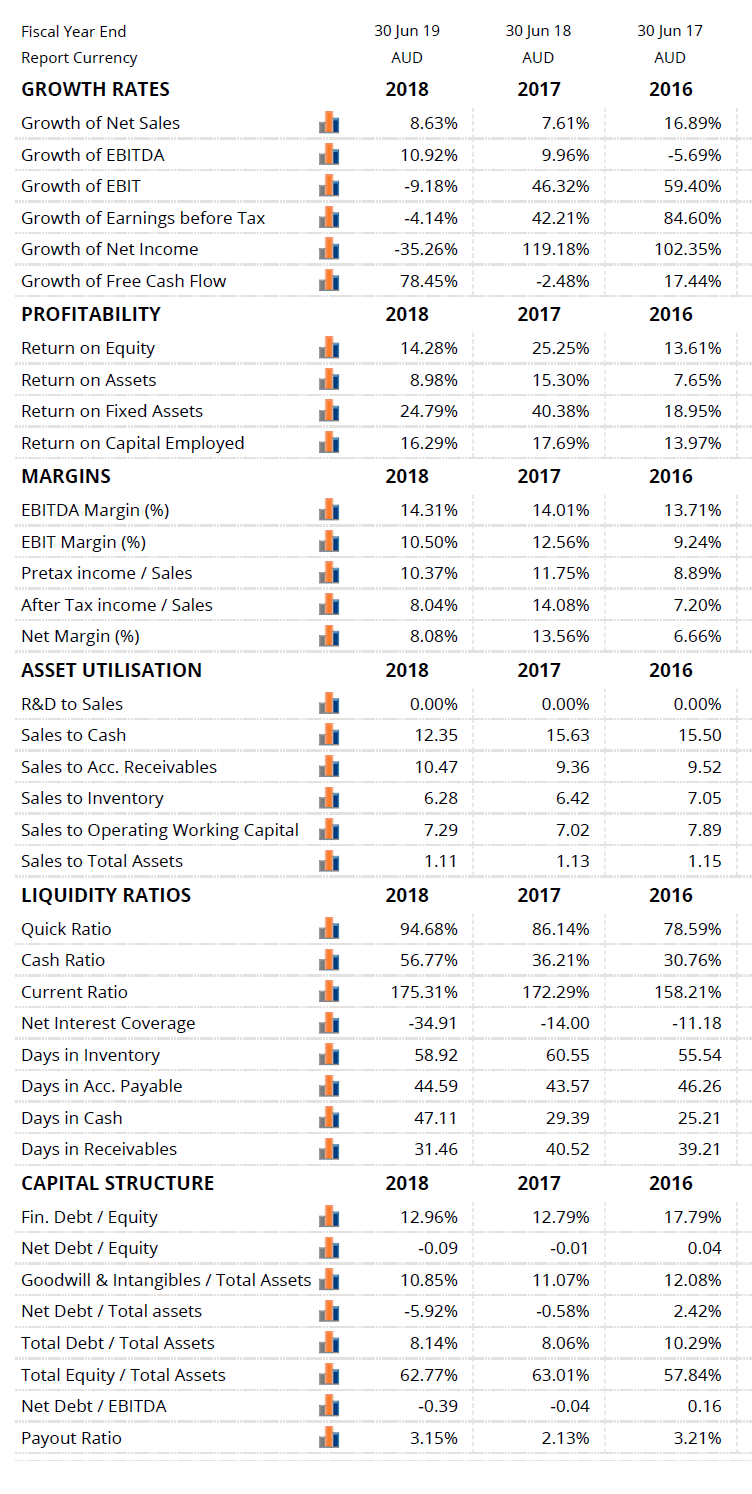
Recommend whether you should invest in Sims Metal Management Limited or Bluescope Steel Limited or alternatively reject both offers. Justify the recommendation based on the evaluation of the risk and profitability of each company and refer to the relevant ratios.
Sims Metal Management Limited:

Bluescope Steel Limited:

30 Jun 19 30 Jun 18 30 Jun 17 Fiscal Year End Report Currency AUD AUD AUD GROWTH RATES 2018 2017 2016 Growth of Net Sales 2.98% 26.94% 9.19% Growth of EBITDA -14.95% 45.41% 163.98% Growth of EBIT -24.97% 69.03% 262.56% -19.06% 41.20% 184.81% Growth of Earnings before Tax Growth of Net Income -25.01% -0.05% 194.04% Growth of Free Cash Flow 114.47% -45.68% 524.55% PROFITABILITY 2018 2017 2016 6.80% 9.79% 10.72% Return on Equity Return on Assets 4.78% 6.85% 7.66% Return on Fixed Assets 12.60% 19.14% 20.82% 10.20% 13.23% 9.16% Return on Capital Employed MARGINS 2018 2017 2016 5.00% 6.05% 5.28% EBITDA Margin (%) EBIT Margin (%) Pretax income / Sales 3.13% 4.29% 3.22% 3.29% 4.18% 3.76% After Tax income / Sales 2.30% 3.16% 4.01% Net Margin (%) 2.30% 3.16% 4.01% ASSET UTILISATION 2018 2017 2016 R&D to Sales 0.00% 0.00% 0.00% Sales to Cash 55.56 59.73 62.59 Sales to Acc. Receivables 20.85 18.41 15.14 13.15 13.30 12.68 Sales to Inventory Sales to Operating Working Capital Sales to Total Assets 14.14 12.61 10.76 2.08 2.17 1.91 2018 2017 2016 LIQUIDITY RATIOS Quick Ratio 102.46% 89.30% 122.89% Cash Ratio 60.27% 44.11% 65.36% 186.73% 174.82% 206.82% -30.99 -31.09 -16.05 24.01 31.66 28.54 Current Ratio Net Interest Coverage Days in Inventory Days in Acc. Payable Days in Cash Days in Receivables 17.78 21.18 19.01 20.76 18.93 26.83 15.07 20.04 24.20 CAPITAL STRUCTURE 2018 2017 2016 1.54% 1.87% 0.28% -0.16 -0.14 -0.19 Fin. Debt / Equity Net Debt / Equity Goodwill & Intangibles / Total Assets Net Debt / Total assets 4.62% 4.48% 4.01% -11.35% -9.66% -13.94% Total Debt / Total Assets 1.11% 1.28% 0.20% Total Equity / Total Assets 72.16% 68.36% 71.73% Net Debt / EBITDA -1.09 -0.79 -1.43 Fiscal Year End Report Currency GROWTH RATES 30 Jun 19 AUD 30 Jun 18 AUD 30 Jun 17 AUD 2018 2017 2016 Growth of Net Sales 8.63% 7.61% 16.89% Growth of EBITDA 10.92% 9.96% -5.69% -9.18% 46.32% 59.40% -4.14% 42.21% 84.60% Growth of EBIT Growth of Earnings before Tax Growth of Net Income Growth of Free Cash Flow PROFITABILITY -35.26% 119.18% 102.35% 78.45% -2.48% 17.44% 2018 2017 2016 14.28% 25.25% 13.61% Return on Equity Return on Assets 8.98% 15.30% 7.65% Return on Fixed Assets 24.79% 40.38% 18.95% 16.29% 17.69% 13.97% 2018 2017 2016 14.31% 14.01% 13.71% 10.50% 12.56% 9.24% Return on Capital Employed MARGINS EBITDA Margin (%) EBIT Margin (%) Pretax income / Sales After Tax income / Sales Net Margin (%) ASSET UTILISATION 10.37% 11.75% 8.89% 8.04% 14.08% 7.20% 8.08% 13.56% 6.66% 2018 2017 2016 R&D to Sales 0.00% 0.00% 0.00% Sales to Cash 12.35 15.63 15.50 10.47 9.36 9.52 6.28 6.42 7.05 7.29 7.02 7.89 Sales to Acc. Receivables Sales to Inventory Sales to Operating Working Capital Sales to Total Assets LIQUIDITY RATIOS Quick Ratio 1.11 1.13 1.15 2018 2017 2016 94.68% 86.14% 78.59% Cash Ratio 56.77% 36.21% 30.76% 175.31% 172.29% 158.21% -34.91 -14.00 -11.18 58.92 60.55 55.54 Current Ratio Net Interest Coverage Days in Inventory Days in Acc. Payable Days in Cash Days in Receivables 44.59 43.57 46.26 47.11 29.39 25.21 31.46 40.52 39.21 CAPITAL STRUCTURE 2018 2017 2016 12.96% 12.79% 17.79% -0.09 -0.01 0.04 Fin. Debt / Equity Net Debt / Equity Goodwill & Intangibles / Total Assets Net Debt / Total assets 10.85% 11.07% 12.08% -5.92% -0.58% 2.42% EE Total Debt / Total Assets 8.14% 8.06% 10.29% Total Equity / Total Assets 62.77% 63.01% 57.84% Net Debt / EBITDA -0.39 -0.04 0.16 Payout Ratio 3.15% 2.13% 3.21%
Step by Step Solution
There are 3 Steps involved in it
Step: 1

Get Instant Access to Expert-Tailored Solutions
See step-by-step solutions with expert insights and AI powered tools for academic success
Step: 2

Step: 3

Ace Your Homework with AI
Get the answers you need in no time with our AI-driven, step-by-step assistance
Get Started


