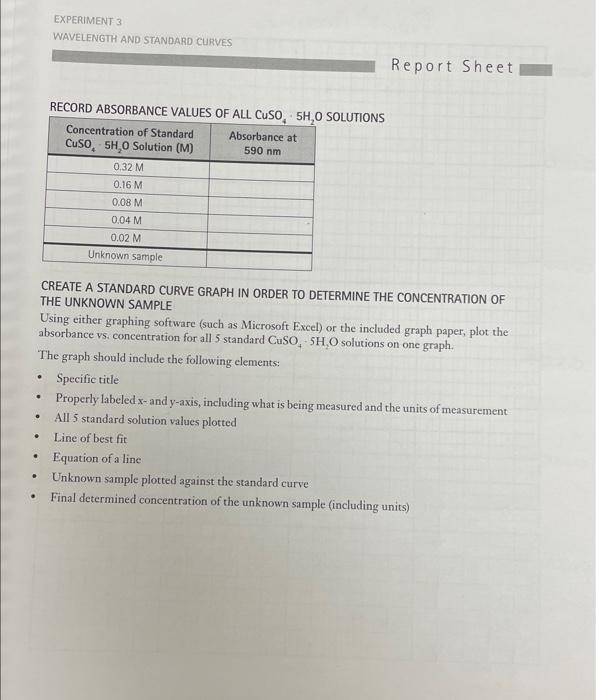
Question: RECORD ABSORBANCE VALUES OF AII CuEN cH A SOLUTIONS CREATE A STANDARD CURVE GRAPH IN ORDER TO DETERMINE THE CONCENTRATION OF THE UNKNOWN SAMPLE Using


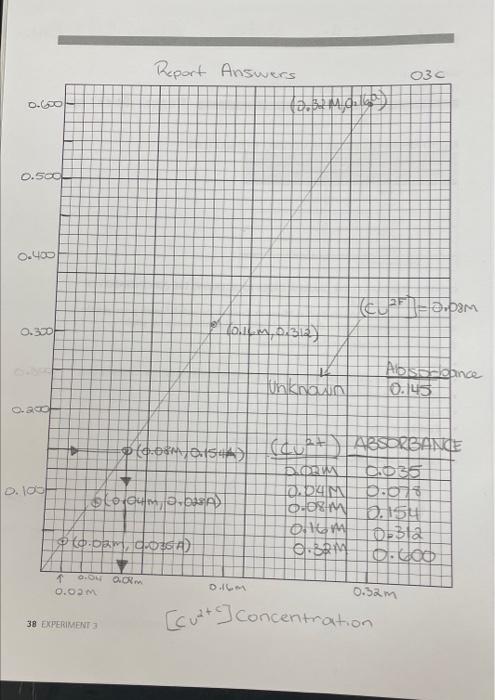
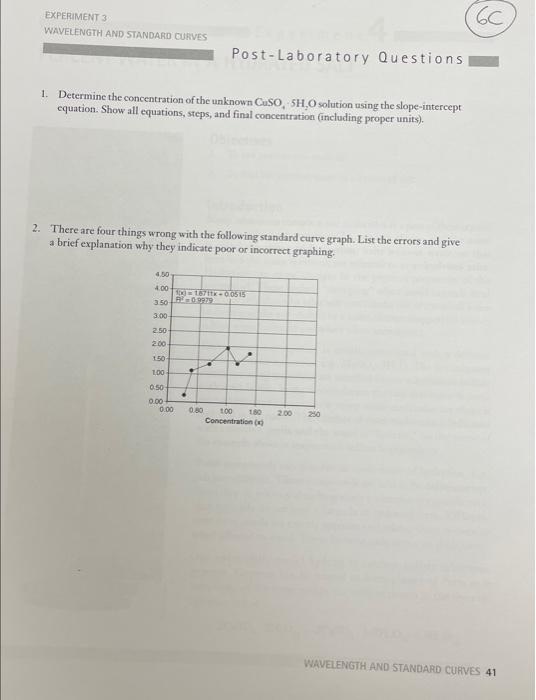
RECORD ABSORBANCE VALUES OF AII CuEN cH A SOLUTIONS CREATE A STANDARD CURVE GRAPH IN ORDER TO DETERMINE THE CONCENTRATION OF THE UNKNOWN SAMPLE Using either graphing software (such as Microsoft Excel) or the included graph paper, plot the absorbance vs. concentration for all 5 standard CuSO45H2Osolutionsononegraph. The graph should include the following elements: - Specific title - Properly labeled x - and y-axis, including what is being measured and the units of measurement- - All 5 standard solution values plotted - Line of best fit - Equation of a line - Unknown sample plotted against the standard curve - Final determined concentration of the unknown sample (including units) Report Answers 1. Determine the concentration of the unknown CuSO4,5H2O solution using the slope-intercept equation. Show all equations, steps, and final concentration (including proper units). 2. There are four things wrong with the following standard curve graph. List the errors and give a brief explanation why they indicate poor or incorrect graphing. RECORD ABSORBANCE VALUES OF AII CuEN cH A SOLUTIONS CREATE A STANDARD CURVE GRAPH IN ORDER TO DETERMINE THE CONCENTRATION OF THE UNKNOWN SAMPLE Using either graphing software (such as Microsoft Excel) or the included graph paper, plot the absorbance vs. concentration for all 5 standard CuSO45H2Osolutionsononegraph. The graph should include the following elements: - Specific title - Properly labeled x - and y-axis, including what is being measured and the units of measurement- - All 5 standard solution values plotted - Line of best fit - Equation of a line - Unknown sample plotted against the standard curve - Final determined concentration of the unknown sample (including units) Report Answers 1. Determine the concentration of the unknown CuSO4,5H2O solution using the slope-intercept equation. Show all equations, steps, and final concentration (including proper units). 2. There are four things wrong with the following standard curve graph. List the errors and give a brief explanation why they indicate poor or incorrect graphing
Step by Step Solution
There are 3 Steps involved in it

Get step-by-step solutions from verified subject matter experts


