Answered step by step
Verified Expert Solution
Question
1 Approved Answer
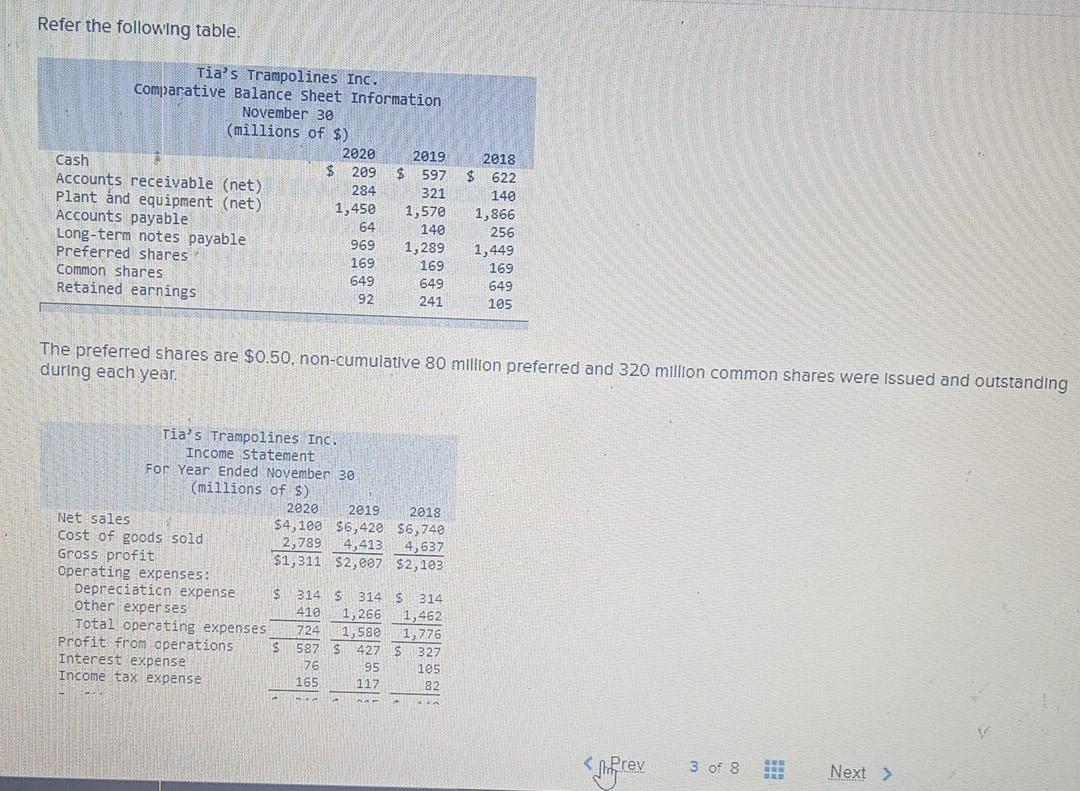
Refer the following table. Tia's Trampolines Inc. Comparative Balance Sheet Information November 30 (millions of $) 2020 2019 Cash $ 209 $ 597 Accounts receivable


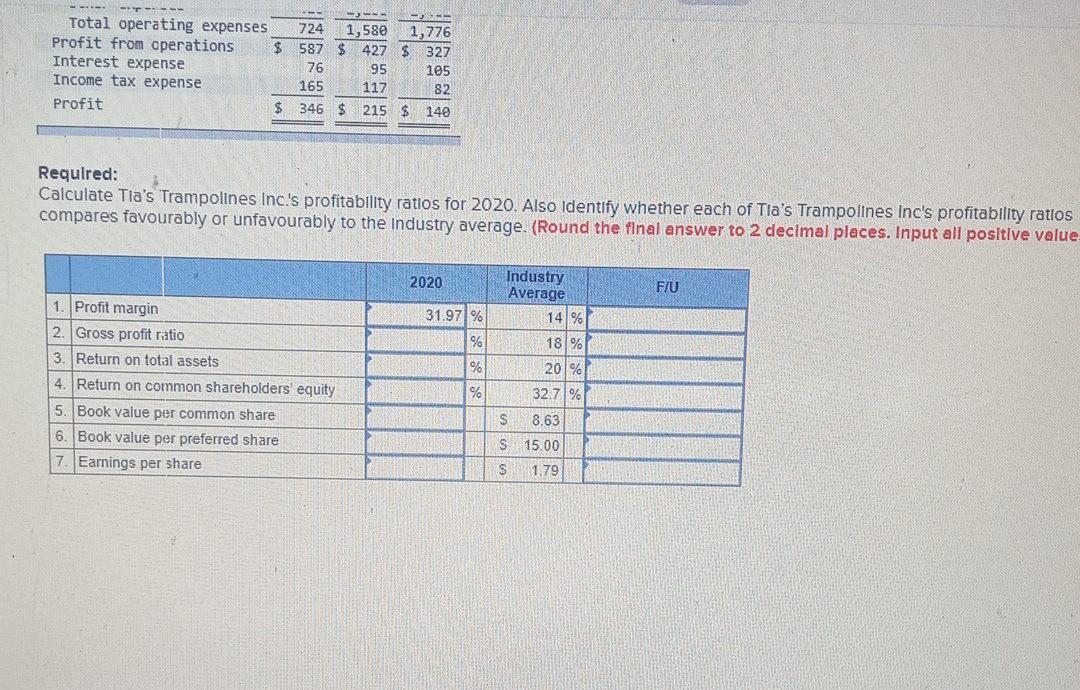
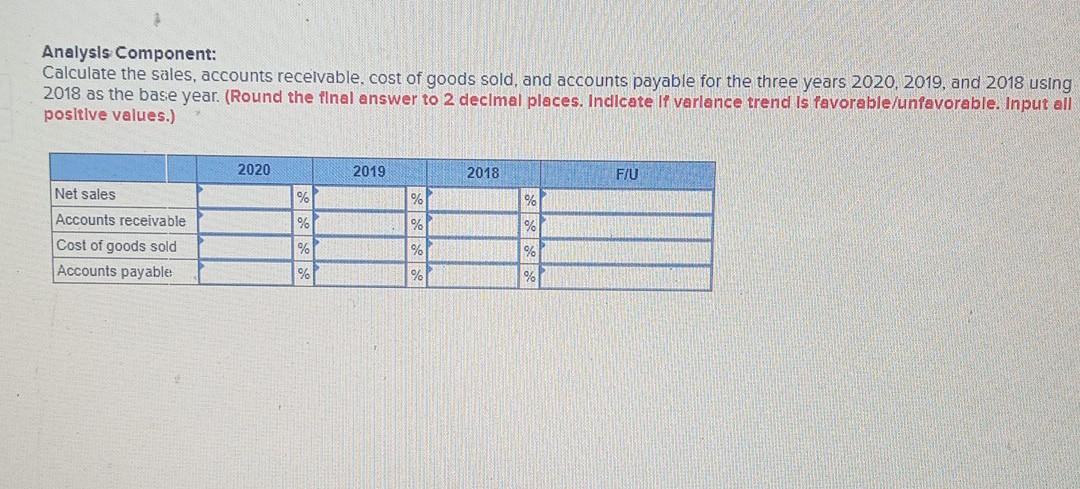
Refer the following table. Tia's Trampolines Inc. Comparative Balance Sheet Information November 30 (millions of $) 2020 2019 Cash $ 209 $ 597 Accounts receivable (net) 284 321 Plant and equipment (net) 1,450 1,570 Accounts payable 64 140 Long-term notes payable 969 1,289 Preferred shares 169 169 Common shares 649 649 Retained earnings 92 241 2018 $ 622 140 1,866 256 1,449 169 649 105 The preferred shares are $0.50, non-cumulative 80 million preferred and 320 million common shares were issued and outstanding during each year. Tia's Trampolines Inc. Income statement For Year Ended November 30 (millions of $) 2020 2019 2018 Net sales $4,100 $6,428 $6,740 Cost of goods sold 2,789 4,413 4,637 Gross profit $1,311 $2,007 $2,103 Operating expenses: Depreciaticn expense $ 314 s 314 $ 314 other exper ses 419 1,266 1,462 Total operating expenses 724 1,58 1,776 Profit from operations $ 587 $427 $327 Interest expense 76 95 105 Income tax expense 165 117 82 Si Tubirev 3 of 8 BER Next > --- --- Total operating expenses 724 1,580 1,776 Profit from operations $ 587 $ 427 $ 327 Interest expense 76 95 105 Income tax expense 165 117 82 Profit $ 346 $ 215 $ 140 Requlred: Calculate Tia's Trampolines Inc.'s profitability ratios for 2020. Also Identify whether each of Tia's Trampolines Inc's profitability ratlos compares favourably or unfavourably to the Industry average. (Round the final answer to 2 decimal places. Input all positive value 2020 F/U Industry Average 141% 31.971% % % 1. Profit margin 2. Gross profit ratio 3. Return on total assets 4. Return on common shareholders' equity 5. Book value per common share 6. Book value per preferred share 7. Earnings per share 18% 20% 32.7% % S 8.63 S 15.00 S 1.79 Analysis Component: Calculate the sales, accounts receivable, cost of goods sold, and accounts payable for the three years 2020, 2019, and 2018 using 2018 as the base year. (Round the final answer to 2 decimal places. Indicate li varlance trend Is favorable/unfavorable. Input all positive values.) 2020 2019 2018 FIU Net sales % % 4 % Accounts receivable Cost of goods sold Accounts payable % % % % % % % %
Step by Step Solution
There are 3 Steps involved in it
Step: 1

Get Instant Access to Expert-Tailored Solutions
See step-by-step solutions with expert insights and AI powered tools for academic success
Step: 2

Step: 3

Ace Your Homework with AI
Get the answers you need in no time with our AI-driven, step-by-step assistance
Get Started


