

Answered step by step
Verified Expert Solution
Question
1 Approved Answer
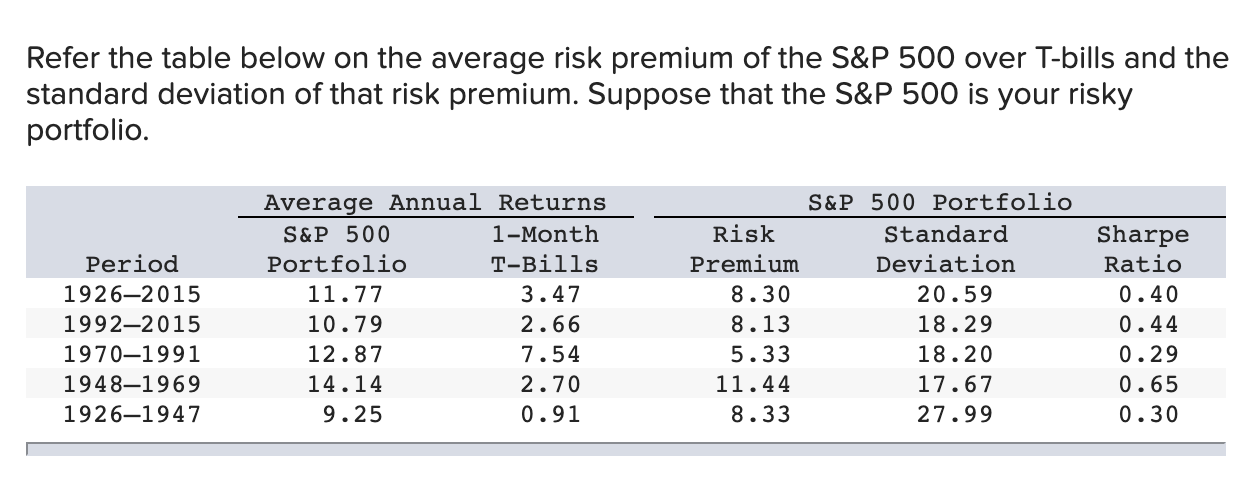
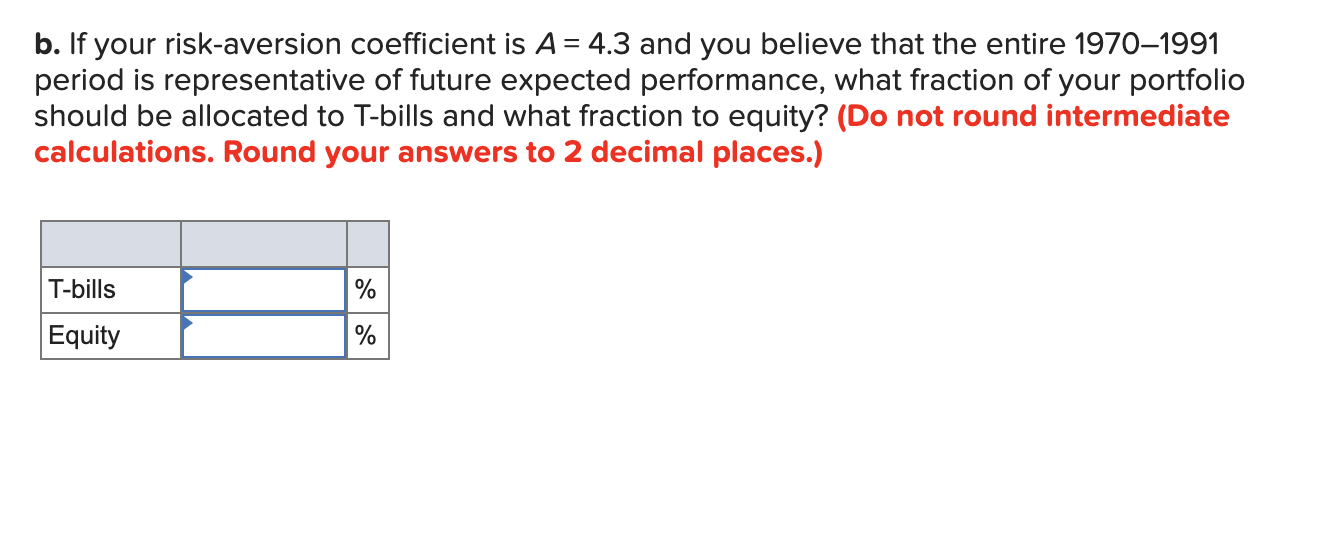
Refer the table below on the average risk premium of the S&P 500 over T-bills and the standard deviation of that risk premium. Suppose that
Step by Step Solution
There are 3 Steps involved in it
Step: 1

Get Instant Access to Expert-Tailored Solutions
See step-by-step solutions with expert insights and AI powered tools for academic success
Step: 2

Step: 3
Ace Your Homework with AI
Get the answers you need in no time with our AI-driven, step-by-step assistance
Get Started
Day Trading Definitive Beginner S Guide
Authors: Brian Stclair
1st Edition
1537510452, 978-1537510453