

Answered step by step
Verified Expert Solution
Question
1 Approved Answer
Refer to Table S6.1 - Factors for Computing_Control Chart Limits (3sigma)2 for this problem. Ross Hopkins is attempting to monitor a filling process that has
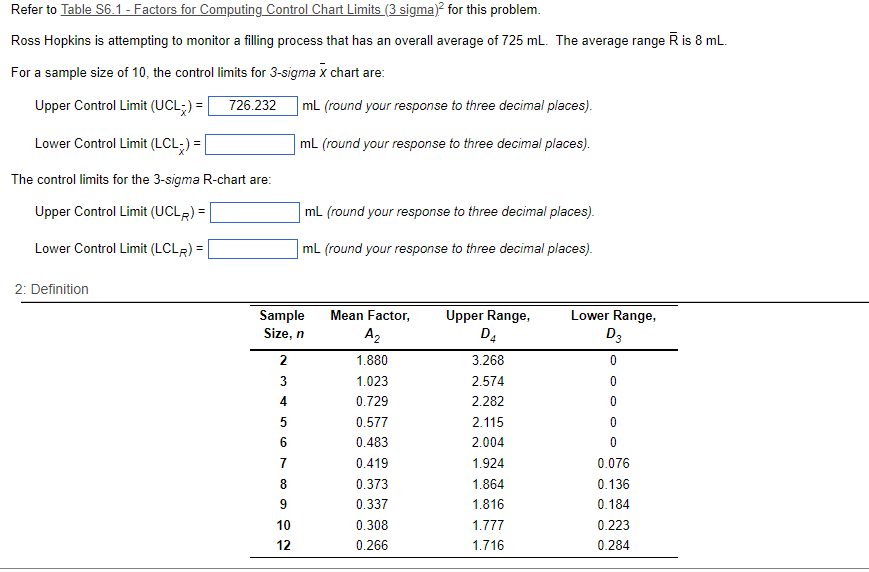
Refer to Table S6.1 - Factors for Computing_Control Chart Limits (3sigma)2 for this problem. Ross Hopkins is attempting to monitor a filling process that has an overall average of 725mL. The average range R is 8mL. For a sample size of 10 , the control limits for 3 -sigma X chart are: Upper Control Limit (UCL)= Lower Control Limit (LCL)= mL (round your response to three decimal places). mL (round your response to three decimal places). The control limits for the 3-sigma R-chart are: Upper Control Limit (UCLR)= Lower Control Limit (LCLR)= mL (round your response to three decimal places). mL (round your response to three decimal places)
Step by Step Solution
There are 3 Steps involved in it
Step: 1

Get Instant Access to Expert-Tailored Solutions
See step-by-step solutions with expert insights and AI powered tools for academic success
Step: 2

Step: 3
Ace Your Homework with AI
Get the answers you need in no time with our AI-driven, step-by-step assistance
Get Started
Management Fundamentals
Authors: Robert N. Lussier
9th Edition
154438419X, 978-1544384191