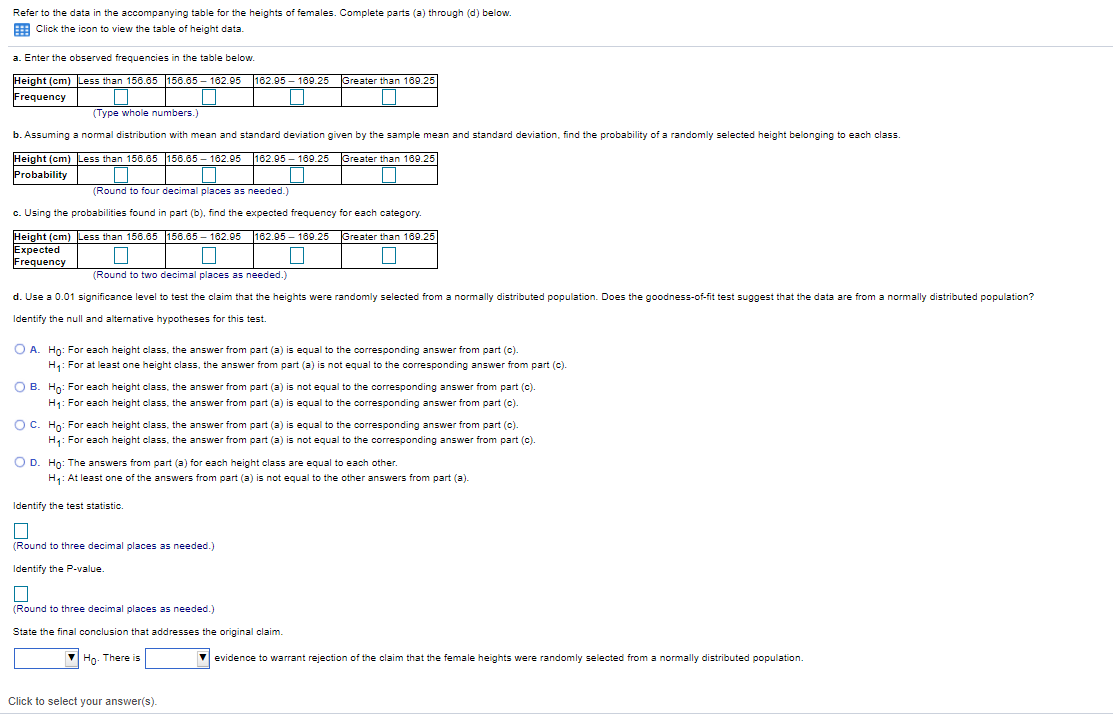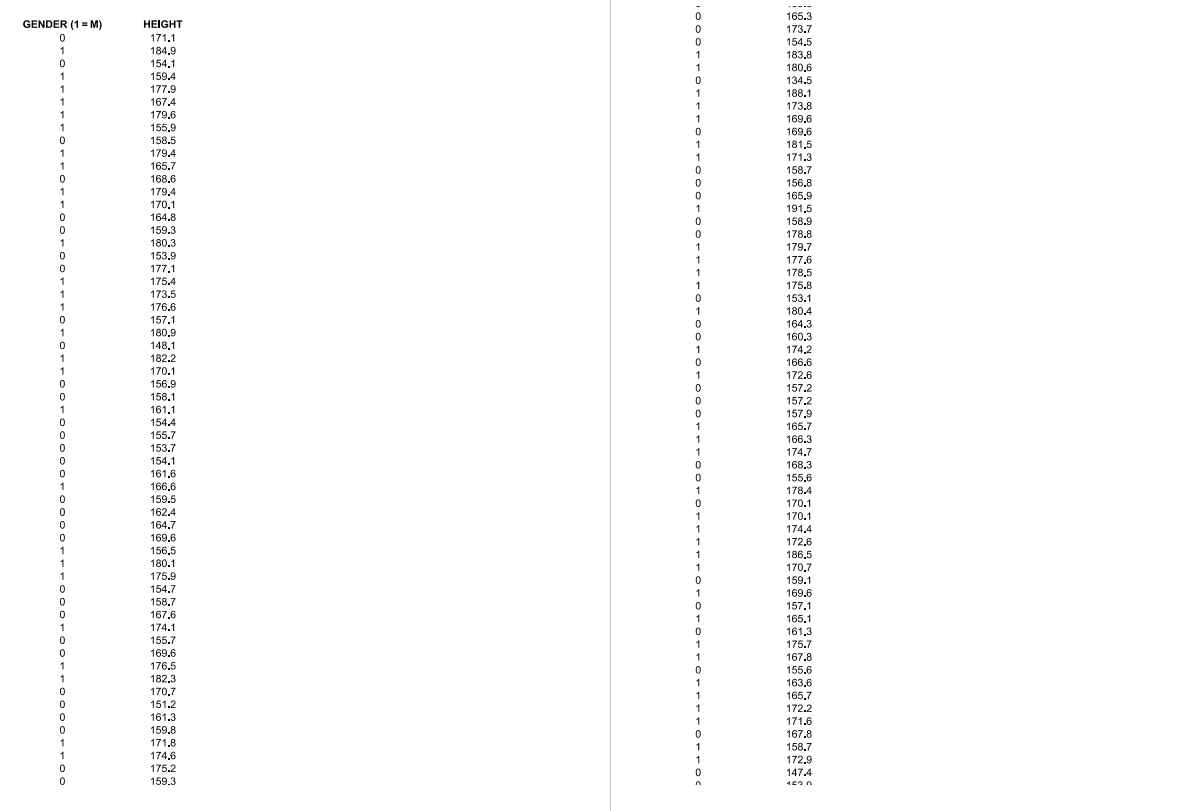


Refer to the data in the accompanying table for the heights of females. Complete parts (a) through (d) below. Click the icon to view the table of height data. a. Enter the observed frequencies in the table below. Height (cm) Less than 156.65 156.65 - 162.95 162.95 - 169.25 Greater than 169.25 Frequency (Type whole numbers.) b. Assuming a normal distribution with mean and standard deviation given by the sample mean and standard deviation, find the probability of a randomly selected height belonging to each class. Greater than 169.25 Height (cm) Less than 156.65 156.65 -162.95 162.95 - 169.25 Probability (Round to four decimal places as needed.) c. Using the probabilities found in part (b), find the expected frequency for each category Greater than 100.25 Height (cm) Less than 156.65 156.65 - 162.95 162.95 - 109.25 Expected Frequency (Round to two decimal places as needed.) d. Use a 0.01 significance level to test the claim that the heights were randomly selected from a normally distributed population. Does the goodness-of-fit test suggest that the data are from a normally distributed population? Identify the null and alternative hypotheses for this test. O A. Ho: For each height class, the answer from part (a) is equal to the corresponding answer from part (c). Hy: For at least one height class, the answer from part (a) is not equal to the corresponding answer from part(). OB. Ho: For each height class, the answer from part (a) is not equal to the corresponding answer from part (c). H4: For each height class, the answer from part (a) is equal to the corresponding answer from part (c). OC. Ho: For each height class, the answer from part (a) is equal to the corresponding answer from part (c). Hy: For each height class, the answer from part (a) is not equal to the corresponding answer from part (c). D. Ho: The answers from part (a) for each height class are equal to each other. Hy: At least one of the answers from part (a) is not equal to the other answers from part (a). Identify the test statistic. (Round to three decimal places as needed.) Identify the P-value (Round to three decimal places as needed.) State the final conclusion that addresses the original claim. Ho. There is evidence to warrant rejection of the claim that the female heights were randomly selected from a normally distributed population. Click to select your answer(s). 1 1 1 1 1 1 1 1 1 1 1 1 1 1 0 1 1 1 1 1 1 13.8 175.2 163.5 155.5 161,3 183,5 166.4 165.8 165.6 168.8 172.9 160.6 181.7 165.5 159.6 159.6 164.5 169.7 180.2 152.5 179.3 168.9 168.3 176.8 165.9 179.5 168.2 158.9 163.7 171.6 161.7 177.9 166.6 160.3 181.4 172.7 157.9 165.2 169.4 163.1 182.6 166.9 160.5 171.6 171.3 165.1 152.9 166.2 166.9 157.4 174.7 156.7 171.1 172.4 162.4 167.3 156.6 163.2 157.4 163,5 182.1 1 1 1 1 1 1 165.2 170.3 165.6 156.1 171.1 161.2 167.2 179.2 176.4 180.4 171.5 165,8 155.4 179.5 169.9 169.4 186.8 171.1 181.7 156.5 171.7 157.5 168.4 169.4 165.9 187.8 145.3 177.9 172.3 151.8 160.1 160.9 175.6 163.2 179.5 148.9 163.3 169.6 174.2 166.4 168.4 148.6 162.3 165.8 163,8 164.9 162.2 163.1 162.7 1 1 0 1 1 1 1 1 1 1 1 1 1 1 1 0 1 1 - - GENDER (1=M OOOOO- OOFOORFOFOFOOOOOOOOOOOOOOOOOOOOOO -OOC N 0 Refer to the data in the accompanying table for the heights of females. Complete parts (a) through (d) below. Click the icon to view the table of height data. a. Enter the observed frequencies in the table below. Height (cm) Less than 156.65 156.65 - 162.95 162.95 - 169.25 Greater than 169.25 Frequency (Type whole numbers.) b. Assuming a normal distribution with mean and standard deviation given by the sample mean and standard deviation, find the probability of a randomly selected height belonging to each class. Greater than 169.25 Height (cm) Less than 156.65 156.65 -162.95 162.95 - 169.25 Probability (Round to four decimal places as needed.) c. Using the probabilities found in part (b), find the expected frequency for each category Greater than 100.25 Height (cm) Less than 156.65 156.65 - 162.95 162.95 - 109.25 Expected Frequency (Round to two decimal places as needed.) d. Use a 0.01 significance level to test the claim that the heights were randomly selected from a normally distributed population. Does the goodness-of-fit test suggest that the data are from a normally distributed population? Identify the null and alternative hypotheses for this test. O A. Ho: For each height class, the answer from part (a) is equal to the corresponding answer from part (c). Hy: For at least one height class, the answer from part (a) is not equal to the corresponding answer from part(). OB. Ho: For each height class, the answer from part (a) is not equal to the corresponding answer from part (c). H4: For each height class, the answer from part (a) is equal to the corresponding answer from part (c). OC. Ho: For each height class, the answer from part (a) is equal to the corresponding answer from part (c). Hy: For each height class, the answer from part (a) is not equal to the corresponding answer from part (c). D. Ho: The answers from part (a) for each height class are equal to each other. Hy: At least one of the answers from part (a) is not equal to the other answers from part (a). Identify the test statistic. (Round to three decimal places as needed.) Identify the P-value (Round to three decimal places as needed.) State the final conclusion that addresses the original claim. Ho. There is evidence to warrant rejection of the claim that the female heights were randomly selected from a normally distributed population. Click to select your answer(s). 1 1 1 1 1 1 1 1 1 1 1 1 1 1 0 1 1 1 1 1 1 13.8 175.2 163.5 155.5 161,3 183,5 166.4 165.8 165.6 168.8 172.9 160.6 181.7 165.5 159.6 159.6 164.5 169.7 180.2 152.5 179.3 168.9 168.3 176.8 165.9 179.5 168.2 158.9 163.7 171.6 161.7 177.9 166.6 160.3 181.4 172.7 157.9 165.2 169.4 163.1 182.6 166.9 160.5 171.6 171.3 165.1 152.9 166.2 166.9 157.4 174.7 156.7 171.1 172.4 162.4 167.3 156.6 163.2 157.4 163,5 182.1 1 1 1 1 1 1 165.2 170.3 165.6 156.1 171.1 161.2 167.2 179.2 176.4 180.4 171.5 165,8 155.4 179.5 169.9 169.4 186.8 171.1 181.7 156.5 171.7 157.5 168.4 169.4 165.9 187.8 145.3 177.9 172.3 151.8 160.1 160.9 175.6 163.2 179.5 148.9 163.3 169.6 174.2 166.4 168.4 148.6 162.3 165.8 163,8 164.9 162.2 163.1 162.7 1 1 0 1 1 1 1 1 1 1 1 1 1 1 1 0 1 1 - - GENDER (1=M OOOOO- OOFOORFOFOFOOOOOOOOOOOOOOOOOOOOOO -OOC N 0


