

Question
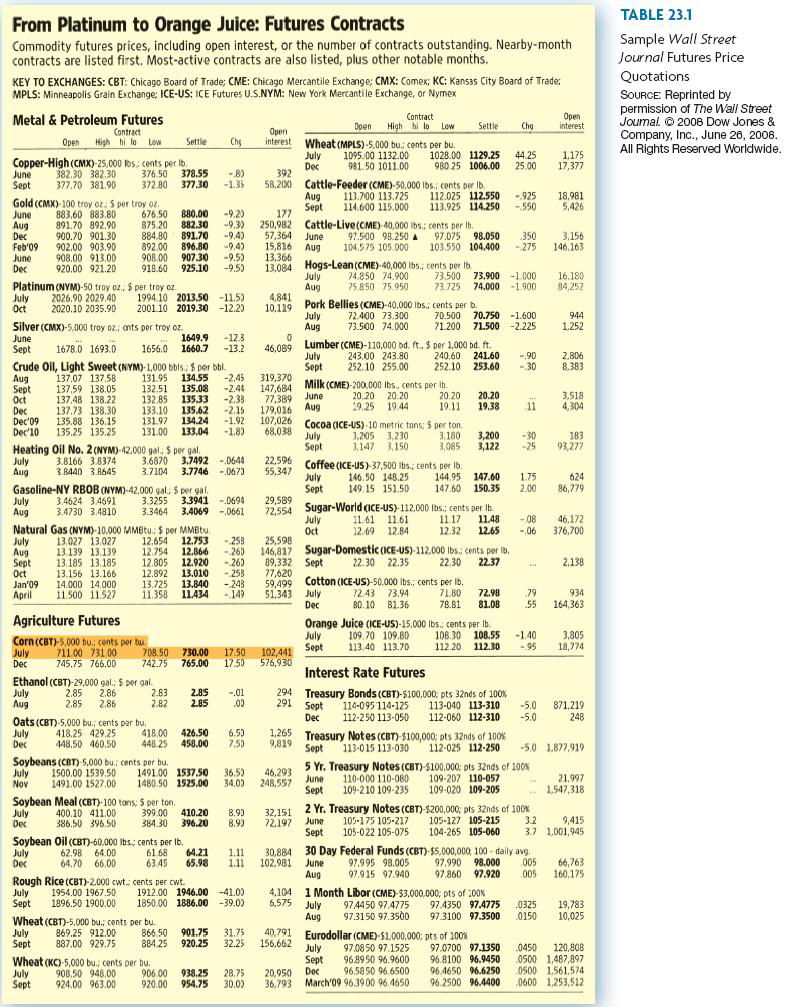
Refer to the table above. Suppose you sell four September 2008 silver futures contracts on June 25, 2008, at the last price of the day.
| Refer to the table above. Suppose you sell four September 2008 silver futures contracts on June 25, 2008, at the last price of the day. |
Required:
| (a) | What will your profit or loss be if silver prices turn out to be $12.01 per ounce at expiration? |
| (Click to select)Loss $91,940Profit $91,940Profit $91,943Loss $91,938Profit $89,780 |
| (b) | What if silver prices are $11.17 per ounce at expiration? |
| (Click to select)Profit $108,740Loss $108,740Loss $108,738Profit $108,743Profit $106,580 |
From Platinum to Orange Juice: Futures Contracts Commodity futures prices, including open interest, or the number of contracts outstanding. Nearby-month contracts are listed first. Most-active contracts are also listed, plus other notable months. KEY TO EXCHANGES: CBT: Chicago Board of Trade; CME: Chicago Mercantile Exchange; CMX: Comex: KC: Kansas City Board of Trade: MPLS: Minneapolis Grain Exchange, ICE-US: ICE Futures U.S.NYM: New York Mercantile Exchange, or Nymex TABLE 23.1 Sample Wall Street Journal Futures Price Quotations SOURCE: Reprinted by permission of The Wall Street Joumal. 2008 Dow Jones & Company, Inc., June 26, 2008. All Rights Reserved Worldwide. Metal & Petroleum Futures Contract Open High hilo low Settle Che Copper-High(CMX)-25,000 lbs, cents per lb. June 382.30 382.30 376 50 378.55 -8) Sept 377.70 381.90 37280 377.30 -1.35 Gold (CMX) 100 troy oz: 5 per troy oz. June 883.60 883.80 676 50 880.00 -9.20 Aug 891.70 892.00 875.20 882.30 -9.3) Dec 900.70 901.30 884.80 891.70 -9.4) Feb 09 902.00903.90 892.00 896.80 -9.43 June 908.00 913.00 908.00 907.30 -9.50 Dec 920.00 921.20 918.60 925.10 -95) Platinum (NYM)-50 troy oz. $ per troy on July 2026.90 2029.40 1994.10 2013.50 -11.5) Oct 2020.10 2035.90 2001.10 2019.30 -12.23 Silver (CMX)-5,000 troy oz., ants per troy oz June 1649.9 -12.3 Sept 1678.0 1693.0 1656.0 1660.7 -13.2 Crude Oil, Light Sweet (NYM) 1,000 bbls, $ per bhl Aug 137.07 137.58 131.95 134.55 -2.45 Sept 137.59 138.05 132.51 135.08 -2.44 Oct 137.48 138.22 132.85 135.33 -2.33 Dec 137.73 138,30 133.10 135.62 -2.15 Dec '09 135.88 136.15 131.92 134.24 -1.92 Dec'10 135.25 135.25 131.00 133.04 -1.89 Heating Oil No. 2 (NYM) 42,000 gal. S pergal July 3.B166 3.8374 3.6870 3.7492-0644 Aug 3.8440 3.8645 3.7104 3.7746 -0673 Gasoline-NY RBOB (NYM)-42,000 gal. S pergal July 3.4624 3.4691 3.3255 3.3941 -0694 Aug 3.4730 3.4810 3.3464 3.4069 -0661 Natural Gas (NYM)-10.000 MMBtu. S per MMBtu July 13.027 13.027 12.654 12.753 - 259 Aug 13.139 13.139 12.754 12.866 - 260 13 185 13.185 12.805 12.920 - 260 Oct 13.156 13.166 12.892 13.010 - 253 Jan'09 14.000 14.000 13.725 13.840 - 243 April 11 500 11527 11.358 11.434 Contract Open Doen High hilo low Settle Cho Open interest interest Wheat (MPLS)-5,000 bucents per bu July 1095.00 1132.00 1028.00 1129.25 44.25 1.175 Dec 981.50 1011.00 980.25 1006.00 25.00 17,377 392 58,200 Cattle-Feeder (CME)-50.000 lbscents per Ib. Aug 113.700 113.725 112.025 112.550 -925 18,981 Sept 114.600 115.000 113.925 114.250 - 550 172 5,426 250,982 Cattle-Live (CME) 40,000 lbs, cents per It, 57,364 June 97.500 98.250 A 97.075 98.050 350 3.156 15,816 Aug 104.575 105.000 103.550 104,400 - 275 146,163 13.366 13.084 Hogs-Lean(CME) 40,000 lbs. cents per to July 74.850 74.900 73.500 73.900 -1.000 16.180 Aug 75 850 75 050 73.725 74.000 1.900 84,252 4,841 10.119 Pork Bellies (CME)-40.000 lbs. cents per b. July 72.400 73.300 70.500 70.750 -1.600 944 Aug 73.500 24.000 71.200 71.500-2.225 1,252 0 46.089 Lumber (CME)-110,000 bd. ft. $ per 1,000 bd. ft. July 243.00 243.80 240.60 241.60 -.90 2,806 Sept 252.10 255.00 252.10 253.60 - 30 8,383 319,370 147,684 Milk (CME)-200.000 lbs., cents per lb. 77,389 June 20.20 20.20 20.20 20.20 3.518 179,016 Aug 19.25 19.44 19.11 19.38 11 4,304 107,026 Cocoa (ICE-US) 10 metric tons; 5 perton 68,038 July 3,205 3,230 3,180 3,200 -30 183 Sept 3.147 3.150 3,085 3,122 -25 03.277 22.596 Coffee (ICE-US) 37,500 lbs., cents per lb. 55,347 July 146.50 145.25 144.95 147.60 1.75 624 Sept 149 15 151.50 147.60 150.35 2.00 86.779 29,589 12.554 Sugar-World CICE-US)-112.000 lbs., cents per lb. July 11.61 1161 11.17 11.48 - 08 46,172 Oct 12.69 12.84 12.32 12.65 -06 376,700 25,598 146,817 Sugar-Domestic (ICE-US)-112,000 lbs. cents per ib. 99,332 Sept 22.30 22.35 22.30 22.37 2,138 77.620 59,499 Cotton (ICE-US)-50,000 lbs. cents per Ib. 51,343 July 72.43 73.94 71.BD 72.98 .79 934 Dec 80.10 81.36 78.81 81.08 .55 164,363 Orange Juice (ICE-US)-15.000 lbs.: cents per lb. July 109.70 109.80 108.30 108.55 -140 3,805 Sept 113.40 113.70 112.20 112.30 -99 18,774 102,441 576,930 Interest Rate Futures 294 Treasury Bonds (CBT)-$100,000 pts 32nds of 100% 291 Sept 114-095 114-125 113-040 113-310 -5.0 871,219 Dec 112-250 113-050 112-060 112-310 -5.0 248 1.265 Treasury Notes (CBT)-$100,000; pts 32nds of 100% 9,819 Sept 113-015 113.030 112-025 112-250 -5.0 1.877,919 5 Yr. Treasury Notes (CBT) $100,000; pis 32nds of 100% 46.293 248,557 June 110-000 110-080 109-207 110-057 21.997 Sept 109-210 109-235 109-020 109-205 1.547,318 32,151 2 Yr. Treasury Notes (CBT)-$200,000, pls 32nds of 100% 72,192 105-175 105-217 105-127 105-215 3.2 9,415 Sept 105-022 105-075 104-265 105-060 3.7 1.001.945 30,884 30 Day Federal Funds (CBT)-$5,000,000 100-daily avg. 102.981 June 97.99598.005 97.990 98.000 005 66,763 Aug 97.915 97.940 97.860 97.920 005 160,175 4,104 1 Month Libor (CME) $3,000,000; pts of 100% 6,575 July 974450 97.4775 97.4350 97.4775 .0325 19,783 Aug 97.3150 97.3500 97.3100 97.3500 0150 10,025 40,791 Eurodollar (CME)-51.000.000: pts of 100% 156,662 July 97.0850 97 1525 97.0700 97.1350 0450 120,80B Sept 96.9950 96.9600 96.8100 96.9450 0500 1,487,897 20,950 Doc 96,58 50 96.650D 96.4650 96.6250 0500 1.561,574 36,793 March 0996.3900 96.4650 96.2500 96.4400 0600 1.253,512 Sept - 149 Agriculture Futures Corn (CBT) 5,000 bucents per tu July 71100 73100 708.50 730.00 17.50 Dec 745.75 766.0D 742.75 765.00 17.50 Ethanol (CBT)-29,000 gal., $ per gal July 2.85 2.86 2.83 2.85 -01 Aug 2.85 2.86 2.82 2.85 00 Oats (CBT) 5,000 bu., cents per bu July 418.25 429.25 418.00 426.50 6.50 Dec 448,50 460.50 448.25 450.00 7.50 Soybeans (CBT) 5,000 bu, cunts per bu. July 1500.00 1539.50 149100 1537.50 36.5) Nov 1491.00 1527.00 1480.50 1525.00 34.03 Soybean Meal (CBT)-100 tons $ per ton July 400.10 411.00 399.00 410.20 8.93 Dec 386.50 396.50 384.30 396.20 8.93 Soybean Oil (CBT)-60.000 lbs.: cents per Ib. July 62.98 64.00 6168 64.21 1.11 Dec 64.70 66.00 63.45 65.98 1.11 Rough Rice (CBT)-2.000 cwt. cents per cwt July 1954.00 1967.50 1912.00 1946.00 -41.0) Sept 1896.50 1900.00 185000 1886.00 -39.0) Wheat (CBT)-5.000 bu.: cents per bu. July 869.25 912.00 866.50 901.75 31.75 Sept 887.00 929.75 884.25 920.25 32.25 Wheat (KC) 5,000 bu, cents per bu. July 908.50 948.00 906.00 938.25 28.75 Sept 924.00 963.00 920.00 954.75 30.03 June
Step by Step Solution
There are 3 Steps involved in it
Step: 1

Get Instant Access to Expert-Tailored Solutions
See step-by-step solutions with expert insights and AI powered tools for academic success
Step: 2

Step: 3
Ace Your Homework with AI
Get the answers you need in no time with our AI-driven, step-by-step assistance
Get Started
Mein Ultimativer Weihnachts Planer
Authors: Zizo Nimane
1st Edition
B0CM2J8GTG