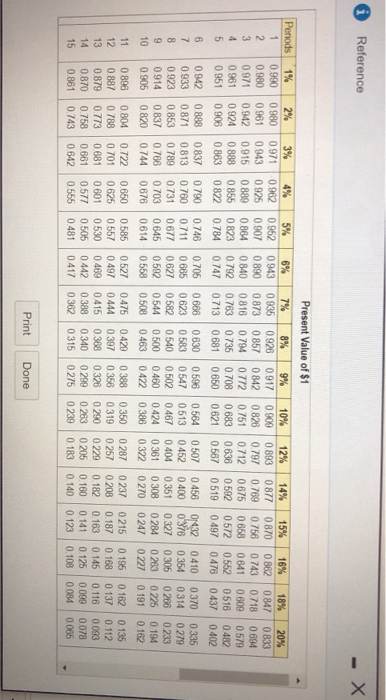
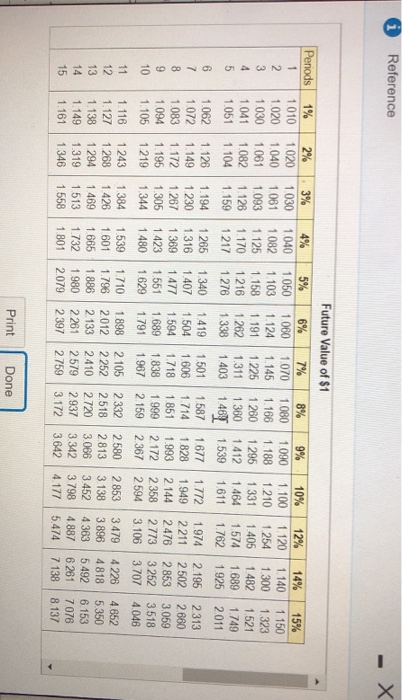
Reference - X Present Value of $1 Periods 6% 1 2 3 4 5 1% 0.990 0.980 0.971 0.961 0951 2% 3% 0980 0.971 0961 0.943 0.942 0915 0924 0888 0906 0.863 0 962 0.925 0.889 0.855 0822 5% 0.952 0.907 0.864 0.823 0.784 0.746 0.711 0677 0.645 0 614 0.943 0 890 0 840 0.792 0.747 7% 0935 0873 0.816 0.763 0.713 14% 0.877 0.789 0675 0.592 0519 12% 0.893 0.797 0.712 0.638 0567 0507 0.452 0.404 0.361 0.322 15% 16% 0870 0.862 0.756 0 743 0658 0.641 0.572 0552 0.497 0478 18% 0.847 0.718 0.609 0516 0437 20% 0833 0694 0.579 0482 0.402 6 7 8 9 10 0.942 0.933 0.923 0.914 0.905 0888 0.871 0853 0.837 0.820 0837 0.813 0.789 0.768 0.744 0.790 0.760 0.731 0.703 0.676 0.705 0.665 0.627 0.592 0.558 8% 9% 0.926 0917 0.857 0 842 0794 0772 0.735 0.708 0.681 0.650 0.630 0.596 0583 0547 0.540 0.502 0.500 0.460 0.463 0.422 0.429 0388 0397 0356 0368 0326 0340 0.299 0.315 0275 10% 0.909 0826 0.751 0 683 0.621 0564 0513 0.467 0.424 0386 0350 0319 0.290 0.263 0.239 0.456 0.400 0351 0.308 0270 ON32 0976 0.327 0284 0.247 0410 0.354 0305 0263 0227 0.666 0.623 0.582 0544 0.508 0.475 0.444 0415 0 388 0.362 0.370 0314 0288 0.225 0.191 0.335 0279 0.233 0.194 0.162 11 12 13 14 15 0896 0.887 0.879 0 870 0.861 0.804 0.788 0.773 0.758 0.743 0.722 0.701 0 681 0.661 0.642 0.650 0.625 0.601 0.577 0.555 0.585 0557 0530 0505 0.481 0.527 0.497 0469 0442 0.417 0287 0.257 0 229 0 205 0.183 0237 0208 0.182 0.160 0.140 0215 0.187 0.163 0.141 0.123 0.195 0.168 0.145 0 125 0.108 0.162 0.137 0.116 0.099 0.084 0.135 0.112 0 093 0.078 0.065 Print Done Reference - X Future Value of $1 7% Perods 1 2 3 4 5 1% 1010 1.020 1.030 1.041 1.051 2% 1.020 1.040 1.061 1.082 1.104 3% 1.030 1.061 1093 1.126 1.159 4% 1 040 1.082 1125 1.170 1217 5% 1.050 1.103 1.158 1.216 1 276 6% 1.060 1.124 1.191 1.262 1338 1.070 1.145 1.225 1.311 1.403 8% 1080 1.166 1280 1.360 9% 1.090 1.188 1 295 1.412 1.539 10% 1.100 1.210 1 331 1.464 1.611 12% 1. 120 1254 1.405 1.574 1.762 14% 1 140 1300 1.482 1.689 1.925 15% 1.150 1.323 1.521 1.749 2011 1.461 6 7 8 9 10 1.062 1072 1.083 1 094 1.105 1.126 1.149 1.172 1.195 1219 1.194 1.230 1267 1.305 1.344 1265 1.316 1 369 1.423 1.480 1.340 1.407 1.477 1.551 1.629 1.419 1.504 1.594 1.689 1.791 1501 1.606 1.718 1.838 1.967 1.587 1.714 1.851 1999 2.159 1.677 1.828 1.993 2.172 2367 1.772 1.949 2.144 2.358 2594 1.974 2211 2476 2773 3.106 2.195 2502 2853 3252 3707 2313 2.660 3.059 3.518 4.046 11 12 13 14 15 1.116 1.127 1.138 1.149 1.161 1 243 1 268 1294 1.319 1.346 1.384 1.426 1469 1513 1.558 1.539 1 601 1.665 1.732 1.801 1.710 1.796 1 886 1.980 2.079 1898 2012 2 133 2 261 2397 2 105 2 252 2410 2579 2.759 2332 2518 2.720 2.937 3.172 2580 2.813 3.066 3 342 3.642 2853 3138 3.452 3.798 4.177 3.479 3.896 4383 4 887 5.474 4226 4 818 5.492 6 261 7.138 4.652 5.350 6.153 7076 8.137 Print Done You are planning for a very early retirement. You would like to retire at age 40 and have enough money saved to be able to withdraw $230,000 per year for the next 30 years based on family history, you think you wil live to age 70). You plan to save by making 10 equal annual installments (from age 30 to 40) into a fairly risky investment and that you expect will earn 8% per year. You will love the money in this fund untiis completely depleted when you are 70 years old (Click the icon to view Present Value of $1 table) Click the icon to view Present Value of Ordinary Annuity of stable) Click the icon to view Future Value of $1 table) Click the icon to view Future Value of Ordinary Annuty of S1 table) Read the requirements Requirement 1. How much money must you accumulate by retirement to make your plan work? (Hint. Find the present value of the $230,000 withdrawals. (Round your final answer to the nearest whole dollar) To make the plan work, you must accumulates by retirement Requirement 2. How does this amount compare to the total amount you will withdraw from the investment during retirement? How can these numbers be so different? Over the course of your resent you will be withdrawings However, by ago 40 you only need to have invested


