Answered step by step
Verified Expert Solution
Question
1 Approved Answer
Regression Statistics Multiple R 0.768904877 R Square 0.591214711 Adjusted R Square 0.584043039 Standard Error 0.049987324 Observations 59 ANOVA df SS MS F Significance F Regression
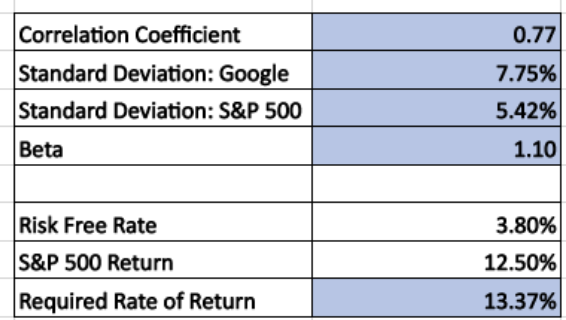
Regression Statistics Multiple R 0.768904877 R Square 0.591214711 Adjusted R Square 0.584043039 Standard Error 0.049987324 Observations 59 ANOVA df SS MS F Significance F Regression 1 0.205989275 0.20598927 82.43750294 1.14521E-12 Residual 57 0.142427757 0.00249873 Total 58 0.348417032 Coefficients Standard Error t Stat P-value Lower 95% Upper 95% Lower 95.0% Upper 95.0% Intercept 0.004609211 0.006593618 0.6990413 0.487368944 -0.00859428 0.0178127 -0.0085943 0.0178127 S&P 500 Return 1.099546659 0.121101981 9.07951006 1.14521E-12 0.857044124 1.34204919 0.85704412 1.34204919 X Variable S&P 500 Return Y Dependent Variable: Google Return Beta of Google 1.10Correlation Coefficient 0.77 Standard Deviation: Google 7.75% Standard Deviation: S&P 500 5.42% Beta 1.10 Risk Free Rate 3.80% S&P 500 Return 12.50% Required Rate of Return 13.37%
Step by Step Solution
There are 3 Steps involved in it
Step: 1
Get Instant Access to Expert-Tailored Solutions
See step-by-step solutions with expert insights and AI powered tools for academic success
Step: 2
Step: 3
Ace Your Homework with AI
Get the answers you need in no time with our AI-driven, step-by-step assistance
Get Started