Relationship between two variables
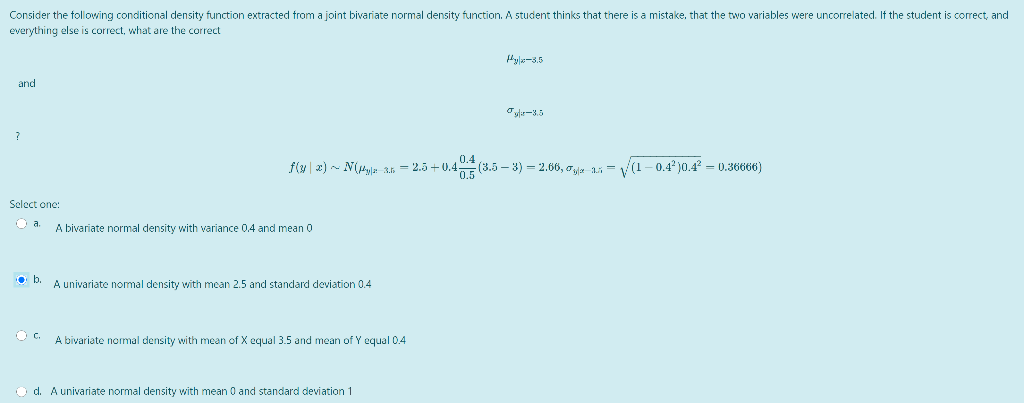
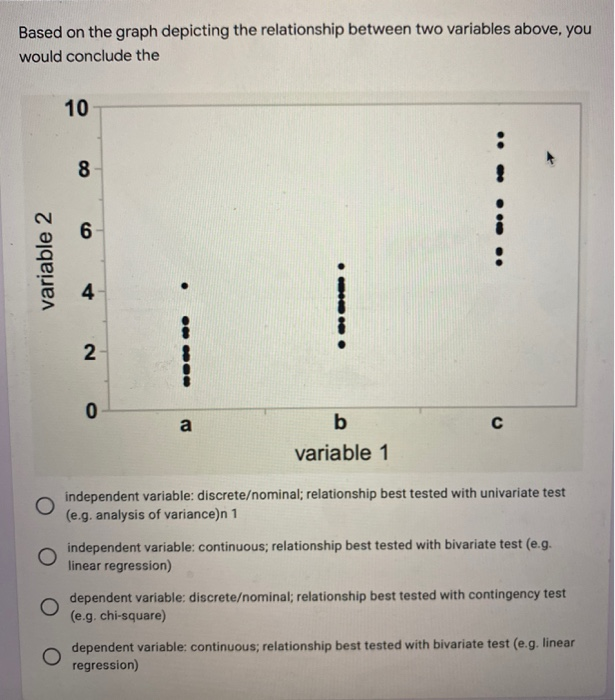
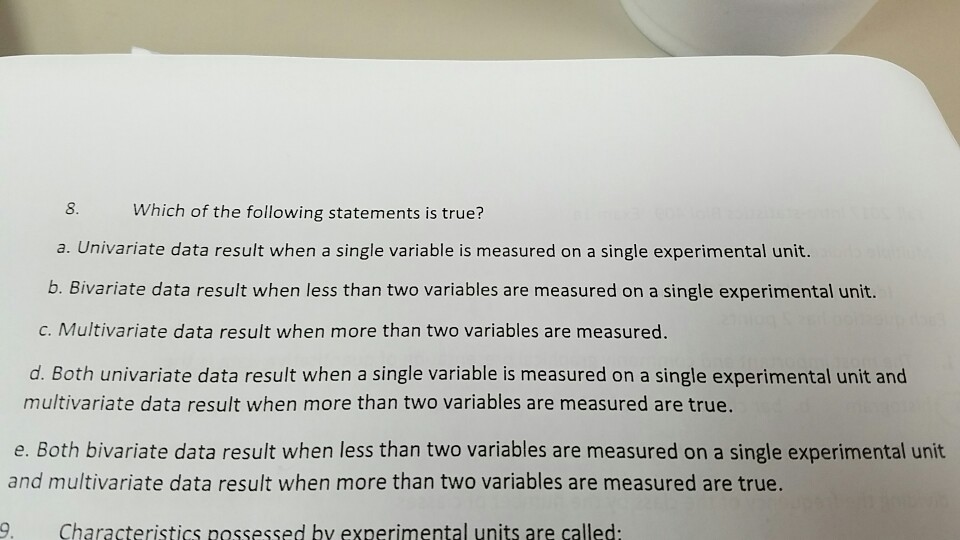
Consider the following conditional density function extracted from a joint bivariate normal density function. A student thinks that there is a mistake, that the two variables were uncorrelated. It the student is correct, and everything else is correct, what are the correct Hyla-3.5 and f(y | x) ~ NUbe an = 25+0.42 TE (3.5 - 3) = 2.60, Jax an = (1 -0.4')0.4" = 0.36660) Select one: A bivariate normal density with variance 0.4 and mean Q b. A univariate normal density with mean 2.5 and standard deviation 0.4 " A bivariate normal density with mean of X equal 3.5 and mean of Y equal 0.4 d. A univariate normal density with mean 0 and standard deviation 1Based on the graph depicting the relationship between two variables above, you would conclude the 10 8 .. .. . . 6 variable 2 4 . .. Im . 2 0 a b C variable 1 O independent variable: discreteominal; relationship best tested with univariate test (e.g. analysis of variance)n 1 O independent variable: continuous; relationship best tested with bivariate test (e.g. linear regression) O dependent variable: discreteominal; relationship best tested with contingency test (e.g. chi-square) O dependent variable: continuous; relationship best tested with bivariate test (e.g. linear regression)8. Which of the following statements is true? a. Univariate data result when a single variable is measured on a single experimental unit. b. Bivariate data result when less than two variables are measured on a single experimental unit. c. Multivariate data result when more than two variables are measured. d. Both univariate data result when a single variable is measured on a single experimental unit and multivariate data result when more than two variables are measured are true. e. Both bivariate data result when less than two variables are measured on a single experimental unit and multivariate data result when more than two variables are measured are true. Characteristics possessed by experimental units are called