Answered step by step
Verified Expert Solution
Question
1 Approved Answer
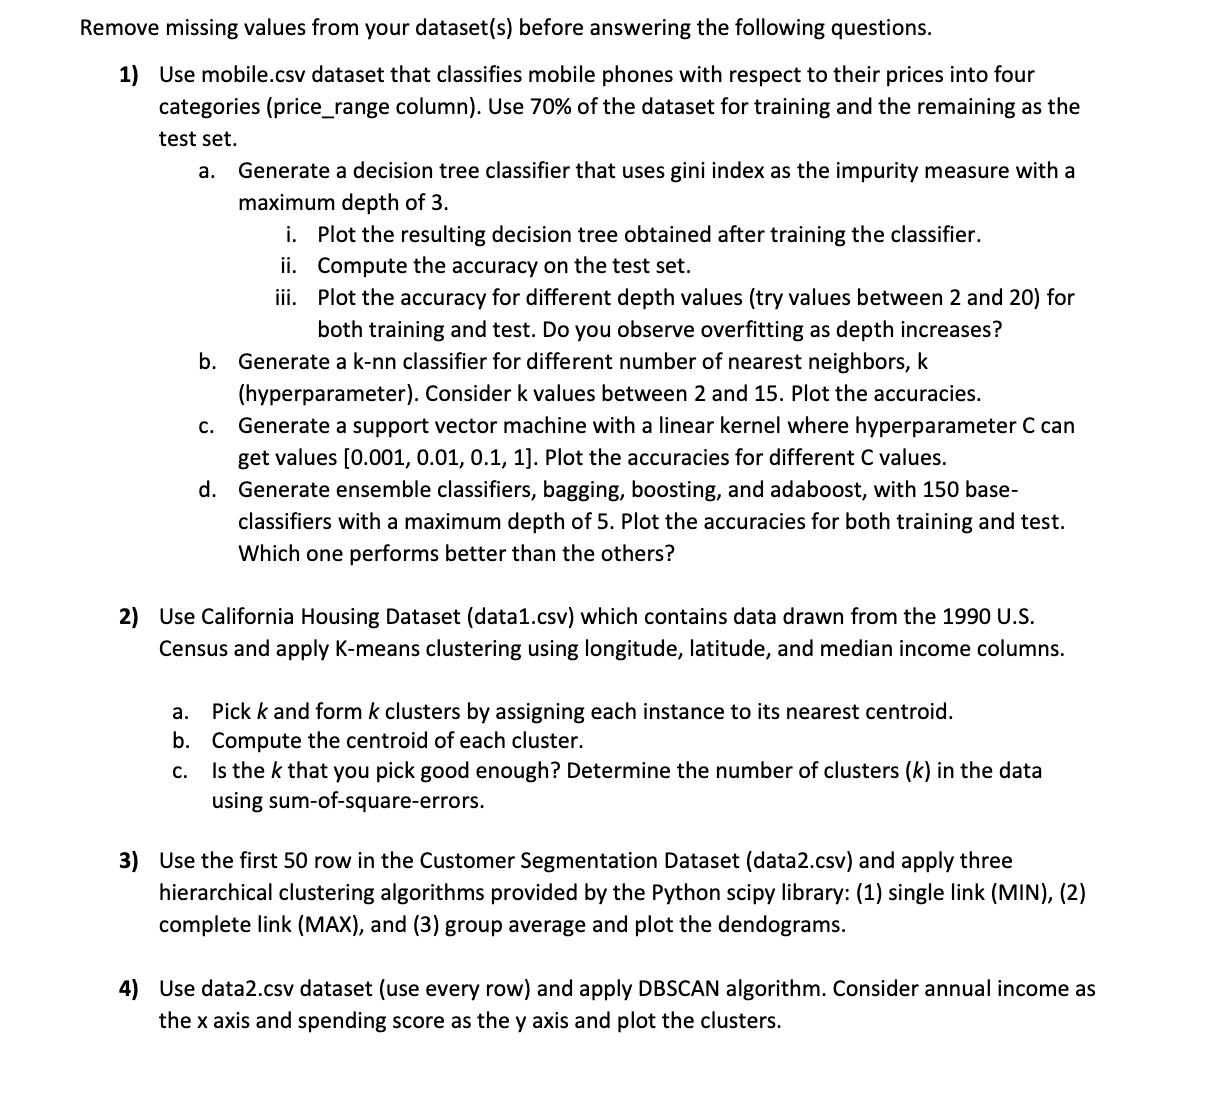
Remove missing values from your dataset(s) before answering the following questions. 1) Use mobile.csv dataset that classifies mobile phones with respect to their prices

Remove missing values from your dataset(s) before answering the following questions. 1) Use mobile.csv dataset that classifies mobile phones with respect to their prices into four categories (price_range column). Use 70% of the dataset for training and the remaining as the test set. a. Generate a decision tree classifier that uses gini index as the impurity measure with a maximum depth of 3. i. Plot the resulting decision tree obtained after training the classifier. ii. Compute the accuracy on the test set. iii. Plot the accuracy for different depth values (try values between 2 and 20) for both training and test. Do you observe overfitting as depth increases? b. Generate a k-nn classifier for different number of nearest neighbors, k (hyperparameter). Consider k values between 2 and 15. Plot the accuracies. C. Generate a support vector machine with a linear kernel where hyperparameter C can get values [0.001, 0.01, 0.1, 1]. Plot the accuracies for different C values. d. Generate ensemble classifiers, bagging, boosting, and adaboost, with 150 base- classifiers with a maximum depth of 5. Plot the accuracies for both training and test. Which one performs better than the others? 2) Use California Housing Dataset (data1.csv) which contains data drawn from the 1990 U.S. Census and apply K-means clustering using longitude, latitude, and median income columns. a. Pick k and form k clusters by assigning each instance to its nearest centroid. b. Compute the centroid of each cluster. C. Is the k that you pick good enough? Determine the number of clusters (k) in the data using sum-of-square-errors. 3) Use the first 50 row in the Customer Segmentation Dataset (data2.csv) and apply three hierarchical clustering algorithms provided by the Python scipy library: (1) single link (MIN), (2) complete link (MAX), and (3) group average and plot the dendograms. 4) Use data2.csv dataset (use every row) and apply DBSCAN algorithm. Consider annual income as the x axis and spending score as the y axis and plot the clusters.
Step by Step Solution
★★★★★
3.56 Rating (156 Votes )
There are 3 Steps involved in it
Step: 1
1 Mobile Price Classification a Decision Tree Classifier Load the mobilecsv dataset Preprocess the dataset by removing any missing values Split the dataset into a training set 70 and a test set 30 Cre...
Get Instant Access to Expert-Tailored Solutions
See step-by-step solutions with expert insights and AI powered tools for academic success
Step: 2

Step: 3

Ace Your Homework with AI
Get the answers you need in no time with our AI-driven, step-by-step assistance
Get Started


