Report on and/or calculate the following financial information for Twitter Inc. (You may choose to do this in a Microsoft Excel spreadsheet and then copy the spreadsheet information into the Microsoft Word
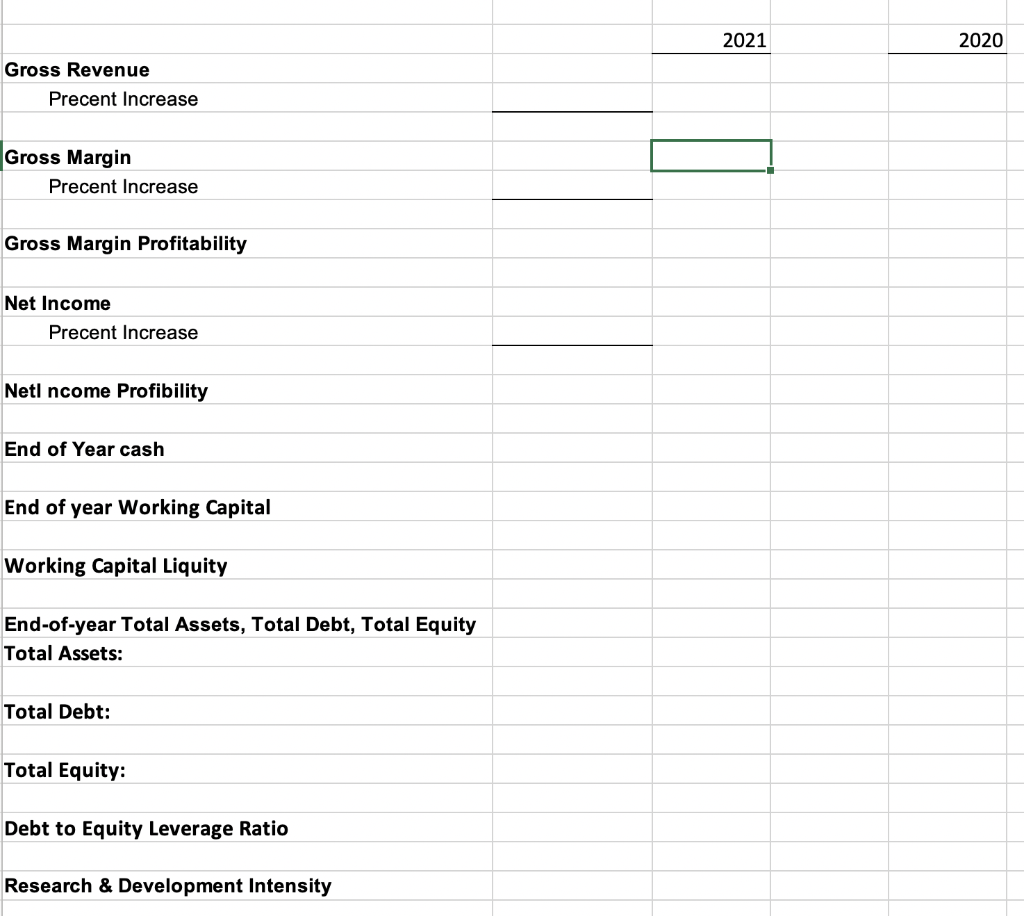
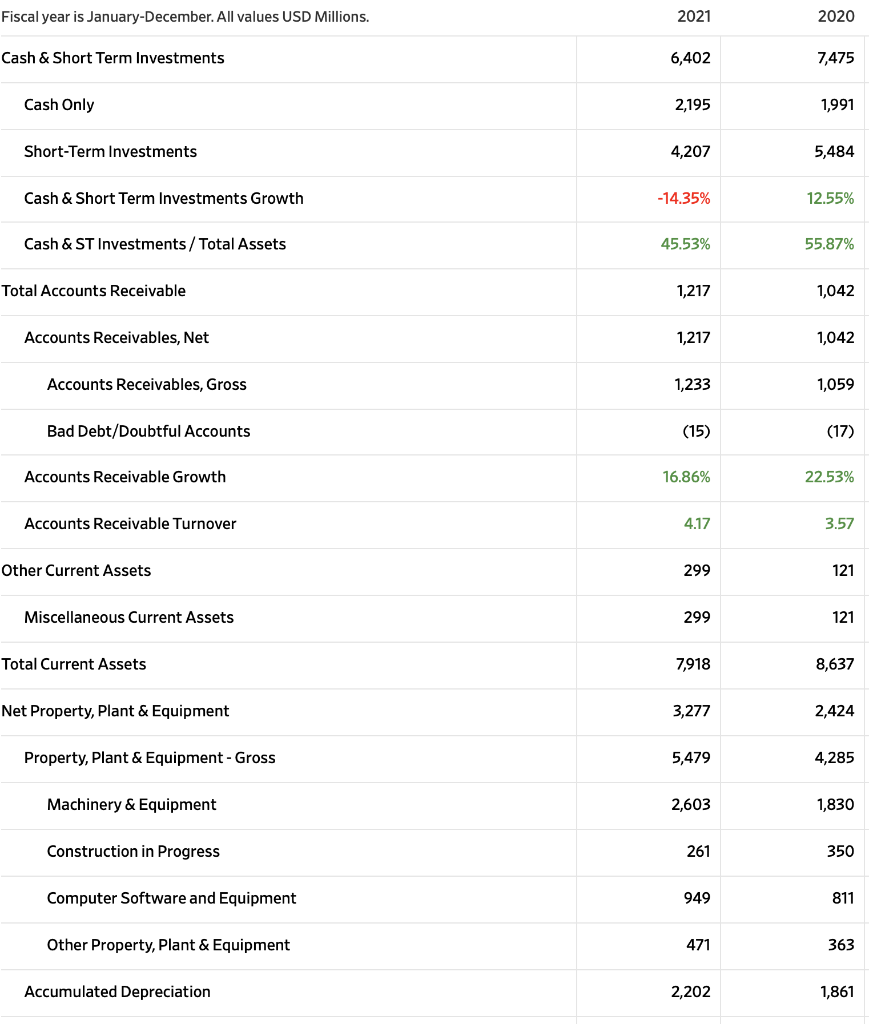
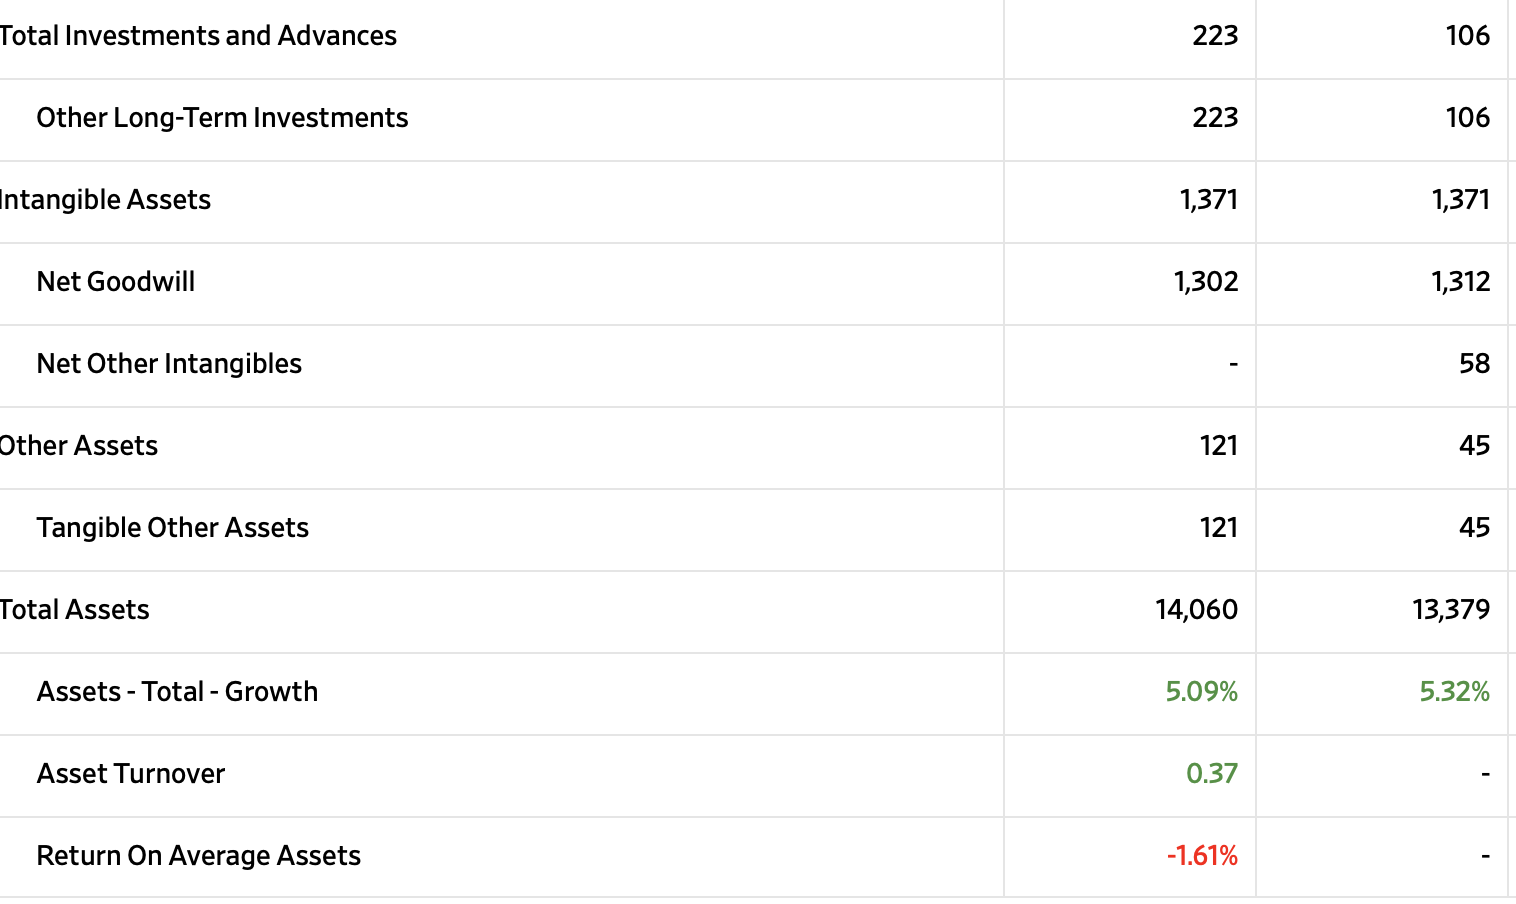
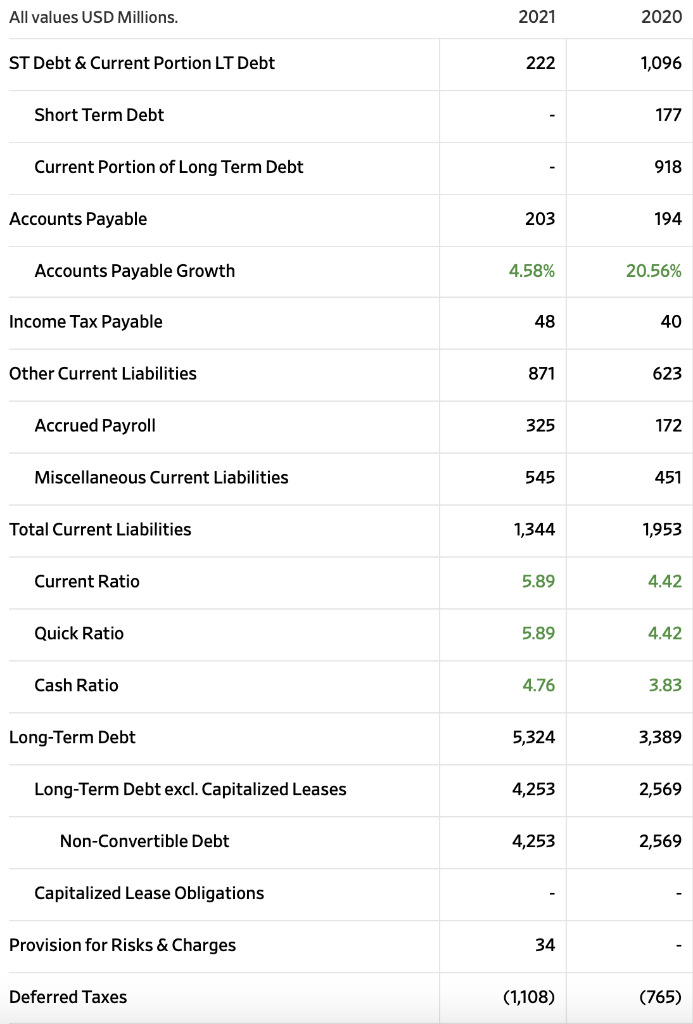
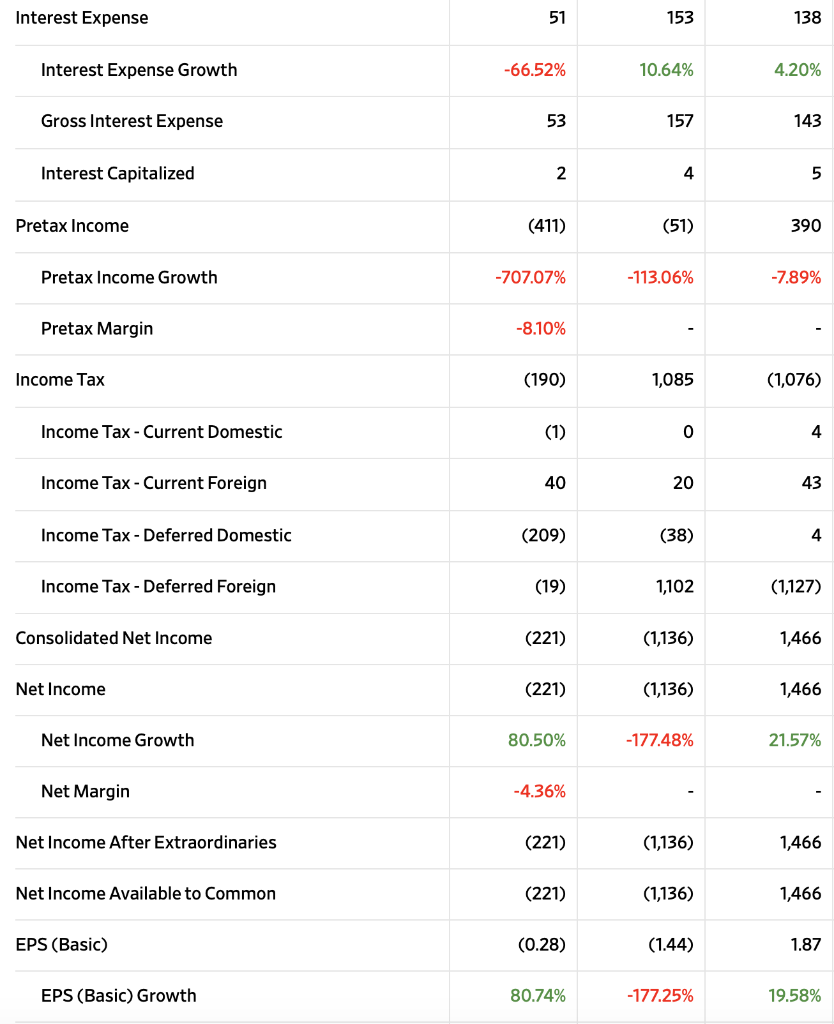
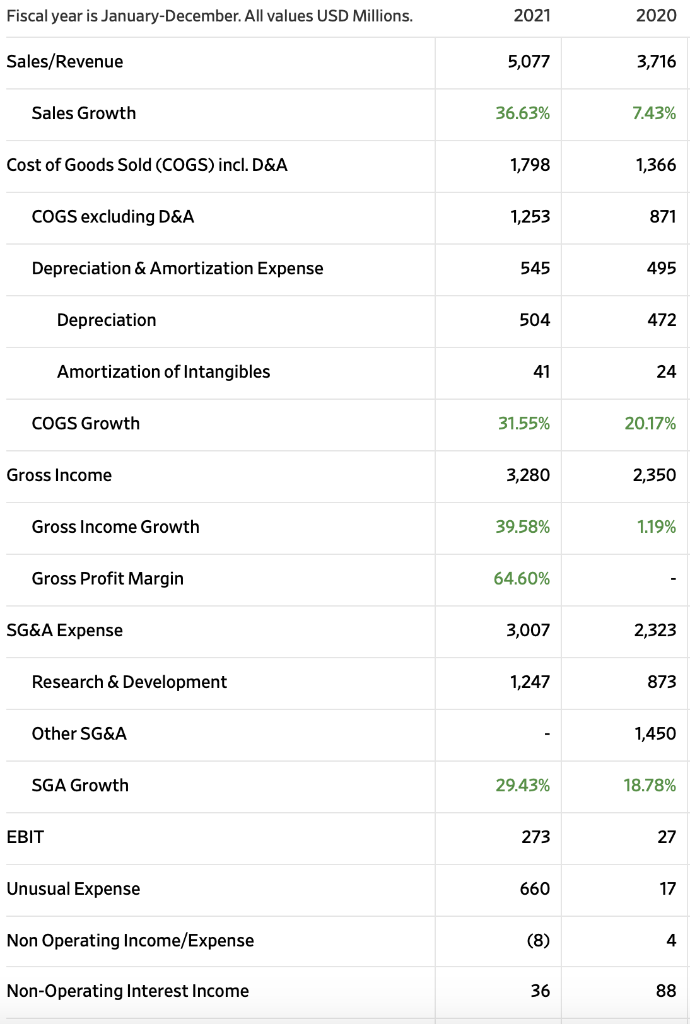
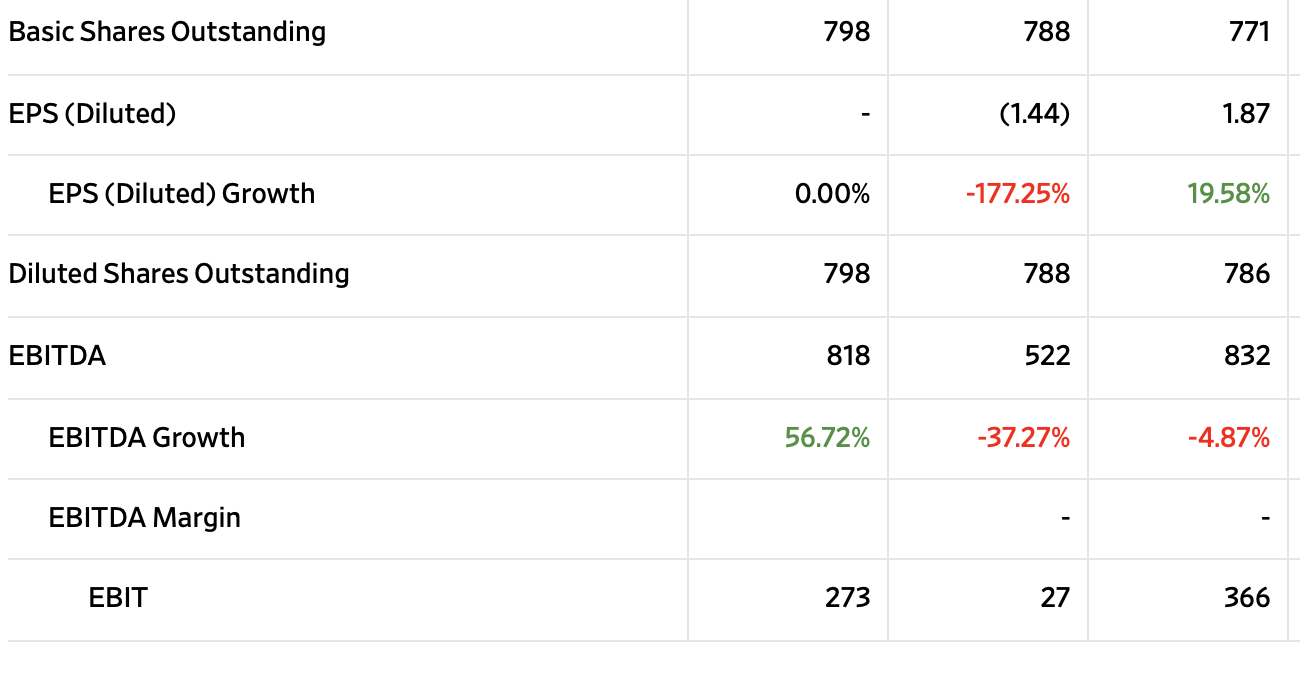
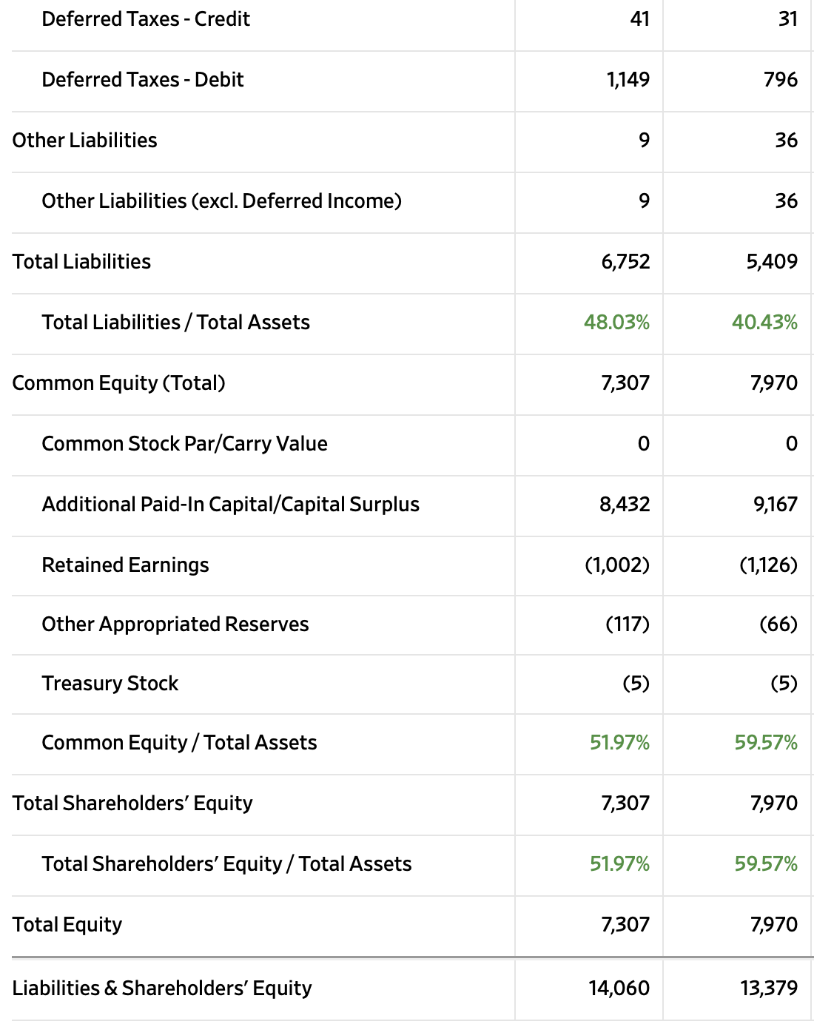
2021 2020 Gross Revenue Precent Increase Gross Margin Precent Increase Gross Margin Profitability Net Income Precent Increase Netl ncome Profibility End of Year cash End of year Working Capital Working Capital Liquity End-of-year Total Assets, Total Debt, Total Equity Total Assets: Total Debt: Total Equity: Debt to Equity Leverage Ratio Research & Development Intensity Fiscal year is January-December. All values USD Millions. 2021 2020 Cash & Short Term Investments 6,402 7,475 Cash Only 2,195 1,991 Short-Term Investments 4,207 5,484 Cash & Short Term Investments Growth -14.35% 12.55% Cash & ST Investments/Total Assets 45.53% 55.87% Total Accounts Receivable 1,217 1,042 Accounts Receivables, Net 1,217 1,042 Accounts Receivables, Gross 1,233 1,059 Bad Debt/Doubtful Accounts (15) (17) Accounts Receivable Growth 16.86% 22.53% Accounts Receivable Turnover 4.17 3.57 Other Current Assets 299 121 Miscellaneous Current Assets 299 121 Total Current Assets 7,918 8,637 Net Property, Plant & Equipment 3,277 2,424 Property, Plant & Equipment - Gross 5,479 4,285 Machinery & Equipment 2,603 1,830 Construction in Progress 261 350 Computer Software and Equipment 949 811 Other Property, Plant & Equipment 471 363 Accumulated Depreciation 2,202 1,861 Total Investments and Advances 223 106 Other Long-Term Investments 223 106 Intangible Assets 1,371 1,371 Net Goodwill 1,302 1,312 Net Other Intangibles 58 Other Assets 121 45 Tangible Other Assets 121 45 Total Assets 14,060 13,379 Assets - Total - Growth 5.09% 5.32% Asset Turnover 0.37 Return On Average Assets -1.61% All values USD Millions. 2021 2020 ST Debt & Current Portion LT Debt 222 1,096 Short Term Debt 177 Current Portion of Long Term Debt - 918 Accounts Payable 203 194 Accounts Payable Growth 4.58% 20.56% Income Tax Payable 48 40 Other Current Liabilities 871 623 Accrued Payroll 325 172 Miscellaneous Current Liabilities 545 451 Total Current Liabilities 1,344 1,953 Current Ratio 5.89 4.42 Quick Ratio 5.89 4.42 Cash Ratio 4.76 3.83 Long-Term Debt 5,324 3,389 Long-Term Debt excl. Capitalized Leases 4,253 2,569 Non-Convertible Debt 4,253 2,569 Capitalized Lease Obligations Provision for Risks & Charges 34 Deferred Taxes (1,108) (765) Interest Expense 51 153 138 Interest Expense Growth -66.52% 10.64% 4.20% Gross Interest Expense 53 157 143 Interest Capitalized 2 4 5 Pretax Income (411) (51) 390 Pretax Income Growth -707.07% -113.06% -7.89% Pretax Margin -8.10% . Income Tax (190) 1,085 (1,076) Income Tax - Current Domestic (1) 0 0 4 4 Income Tax - Current Foreign 40 20 43 Income Tax-Deferred Domestic (209) (38) 4 Income Tax - Deferred Foreign (19) 1,102 (1,127) Consolidated Net Income (221) (1,136) 1,466 Net Income (221) (1,136) 1,466 Net Income Growth 80.50% -177.48% 21.57% Net Margin -4.36% Net Income After Extraordinaries (221) (1,136) 1,466 Net Income Available to Common (221) (1,136) 1,466 EPS (Basic) (0.28) (1.44) 1.87 EPS (Basic) Growth 80.74% -177.25% 19.58% Fiscal year is January-December. All values USD Millions. 2021 2020 Sales/Revenue 5,077 3,716 Sales Growth 36.63% 7.43% Cost of Goods Sold (COGS) incl. D&A 1,798 1,366 COGS excluding D&A 1,253 871 Depreciation & Amortization Expense 545 495 Depreciation 504 472 Amortization of Intangibles 41 24 COGS Growth 31.55% 20.17% Gross Income 3,280 2,350 Gross Income Growth 39.58% 1.19% Gross Profit Margin 64.60% SG&A Expense 3,007 2,323 Research & Development 1,247 873 Other SG&A 1,450 SGA Growth 29.43% 18.78% EBIT 273 27 Unusual Expense 660 17 Non Operating Income/Expense (8) + 4 Non-Operating Interest Income 36 88 Basic Shares Outstanding 798 788 771 EPS (Diluted) (1.44) 1.87 EPS (Diluted) Growth 0.00% -177.25% 19.58% Diluted Shares Outstanding 798 788 786 EBITDA 818 522 832 EBITDA Growth 56.72% -37.27% -4.87% EBITDA Margin EBIT 273 27 366 Deferred Taxes - Credit 41 31 Deferred Taxes - Debit 1,149 796 Other Liabilities 9 36 Other Liabilities (excl. Deferred Income) 9 36 Total Liabilities 6,752 5,409 Total Liabilities/Total Assets 48.03% 40.43% Common Equity (Total) 7,307 7,970 Common Stock Par/Carry Value 0 0 Additional Paid-In Capital/Capital Surplus 8,432 9,167 Retained Earnings (1,002) (1,126) Other Appropriated Reserves (117) (66) Treasury Stock (5) (5) Common Equity / Total Assets 51.97% 59.57% Total Shareholders' Equity 7,307 7,970 Total Shareholders' Equity / Total Assets 51.97% 59.57% Total Equity 7,307 7,970 Liabilities & Shareholders' Equity 14,060 13,379 2021 2020 Gross Revenue Precent Increase Gross Margin Precent Increase Gross Margin Profitability Net Income Precent Increase Netl ncome Profibility End of Year cash End of year Working Capital Working Capital Liquity End-of-year Total Assets, Total Debt, Total Equity Total Assets: Total Debt: Total Equity: Debt to Equity Leverage Ratio Research & Development Intensity Fiscal year is January-December. All values USD Millions. 2021 2020 Cash & Short Term Investments 6,402 7,475 Cash Only 2,195 1,991 Short-Term Investments 4,207 5,484 Cash & Short Term Investments Growth -14.35% 12.55% Cash & ST Investments/Total Assets 45.53% 55.87% Total Accounts Receivable 1,217 1,042 Accounts Receivables, Net 1,217 1,042 Accounts Receivables, Gross 1,233 1,059 Bad Debt/Doubtful Accounts (15) (17) Accounts Receivable Growth 16.86% 22.53% Accounts Receivable Turnover 4.17 3.57 Other Current Assets 299 121 Miscellaneous Current Assets 299 121 Total Current Assets 7,918 8,637 Net Property, Plant & Equipment 3,277 2,424 Property, Plant & Equipment - Gross 5,479 4,285 Machinery & Equipment 2,603 1,830 Construction in Progress 261 350 Computer Software and Equipment 949 811 Other Property, Plant & Equipment 471 363 Accumulated Depreciation 2,202 1,861 Total Investments and Advances 223 106 Other Long-Term Investments 223 106 Intangible Assets 1,371 1,371 Net Goodwill 1,302 1,312 Net Other Intangibles 58 Other Assets 121 45 Tangible Other Assets 121 45 Total Assets 14,060 13,379 Assets - Total - Growth 5.09% 5.32% Asset Turnover 0.37 Return On Average Assets -1.61% All values USD Millions. 2021 2020 ST Debt & Current Portion LT Debt 222 1,096 Short Term Debt 177 Current Portion of Long Term Debt - 918 Accounts Payable 203 194 Accounts Payable Growth 4.58% 20.56% Income Tax Payable 48 40 Other Current Liabilities 871 623 Accrued Payroll 325 172 Miscellaneous Current Liabilities 545 451 Total Current Liabilities 1,344 1,953 Current Ratio 5.89 4.42 Quick Ratio 5.89 4.42 Cash Ratio 4.76 3.83 Long-Term Debt 5,324 3,389 Long-Term Debt excl. Capitalized Leases 4,253 2,569 Non-Convertible Debt 4,253 2,569 Capitalized Lease Obligations Provision for Risks & Charges 34 Deferred Taxes (1,108) (765) Interest Expense 51 153 138 Interest Expense Growth -66.52% 10.64% 4.20% Gross Interest Expense 53 157 143 Interest Capitalized 2 4 5 Pretax Income (411) (51) 390 Pretax Income Growth -707.07% -113.06% -7.89% Pretax Margin -8.10% . Income Tax (190) 1,085 (1,076) Income Tax - Current Domestic (1) 0 0 4 4 Income Tax - Current Foreign 40 20 43 Income Tax-Deferred Domestic (209) (38) 4 Income Tax - Deferred Foreign (19) 1,102 (1,127) Consolidated Net Income (221) (1,136) 1,466 Net Income (221) (1,136) 1,466 Net Income Growth 80.50% -177.48% 21.57% Net Margin -4.36% Net Income After Extraordinaries (221) (1,136) 1,466 Net Income Available to Common (221) (1,136) 1,466 EPS (Basic) (0.28) (1.44) 1.87 EPS (Basic) Growth 80.74% -177.25% 19.58% Fiscal year is January-December. All values USD Millions. 2021 2020 Sales/Revenue 5,077 3,716 Sales Growth 36.63% 7.43% Cost of Goods Sold (COGS) incl. D&A 1,798 1,366 COGS excluding D&A 1,253 871 Depreciation & Amortization Expense 545 495 Depreciation 504 472 Amortization of Intangibles 41 24 COGS Growth 31.55% 20.17% Gross Income 3,280 2,350 Gross Income Growth 39.58% 1.19% Gross Profit Margin 64.60% SG&A Expense 3,007 2,323 Research & Development 1,247 873 Other SG&A 1,450 SGA Growth 29.43% 18.78% EBIT 273 27 Unusual Expense 660 17 Non Operating Income/Expense (8) + 4 Non-Operating Interest Income 36 88 Basic Shares Outstanding 798 788 771 EPS (Diluted) (1.44) 1.87 EPS (Diluted) Growth 0.00% -177.25% 19.58% Diluted Shares Outstanding 798 788 786 EBITDA 818 522 832 EBITDA Growth 56.72% -37.27% -4.87% EBITDA Margin EBIT 273 27 366 Deferred Taxes - Credit 41 31 Deferred Taxes - Debit 1,149 796 Other Liabilities 9 36 Other Liabilities (excl. Deferred Income) 9 36 Total Liabilities 6,752 5,409 Total Liabilities/Total Assets 48.03% 40.43% Common Equity (Total) 7,307 7,970 Common Stock Par/Carry Value 0 0 Additional Paid-In Capital/Capital Surplus 8,432 9,167 Retained Earnings (1,002) (1,126) Other Appropriated Reserves (117) (66) Treasury Stock (5) (5) Common Equity / Total Assets 51.97% 59.57% Total Shareholders' Equity 7,307 7,970 Total Shareholders' Equity / Total Assets 51.97% 59.57% Total Equity 7,307 7,970 Liabilities & Shareholders' Equity 14,060 13,379


