

Answered step by step
Verified Expert Solution
Question
1 Approved Answer
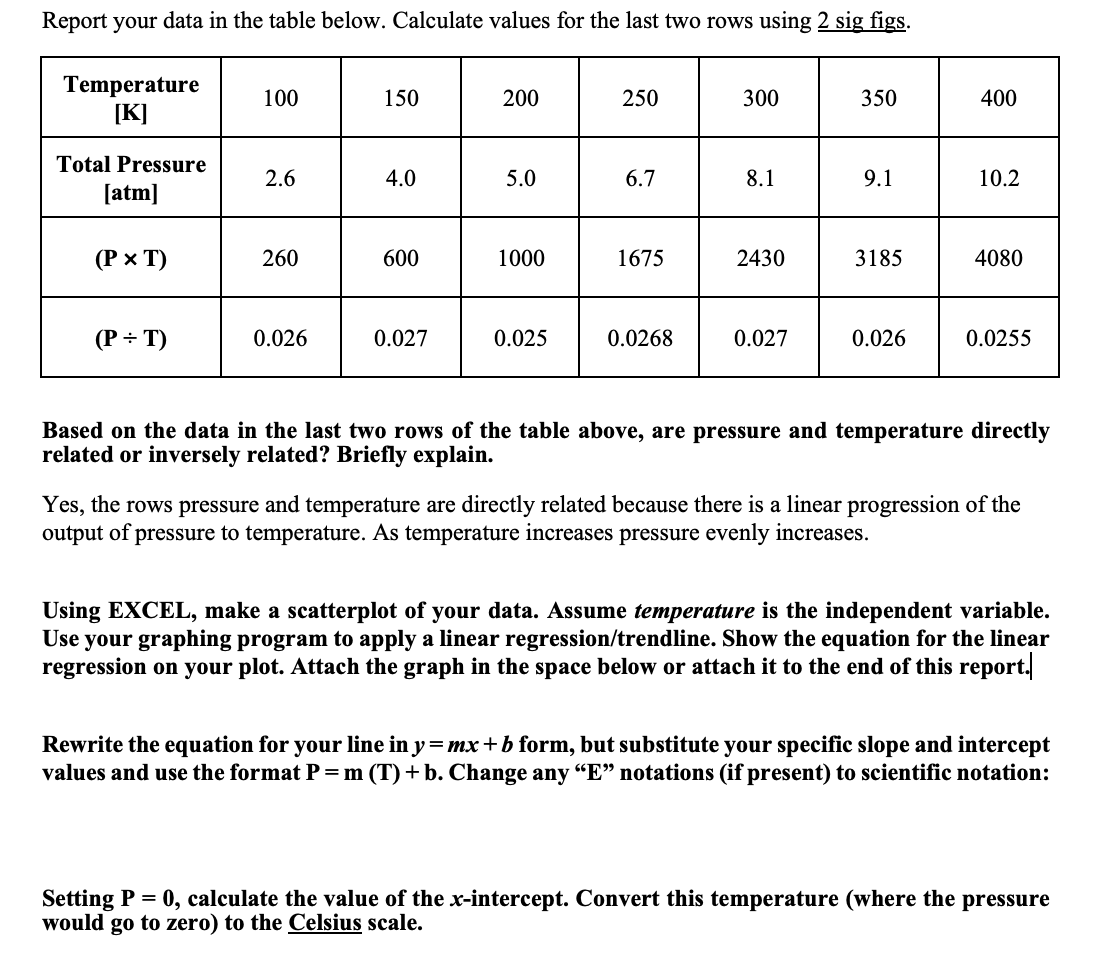
Report your data in the table below. Calculate values for the last two rows using 2 sig figs. Temperature [K] 100 150 200 250 300
Step by Step Solution
There are 3 Steps involved in it
Step: 1

Get Instant Access to Expert-Tailored Solutions
See step-by-step solutions with expert insights and AI powered tools for academic success
Step: 2

Step: 3
Ace Your Homework with AI
Get the answers you need in no time with our AI-driven, step-by-step assistance
Get Started
Bioprocess Engineering Basic Concepts
Authors: Michael L. Shuler, Fikret Kargi
1st Edition
0134782151, 978-0134782157