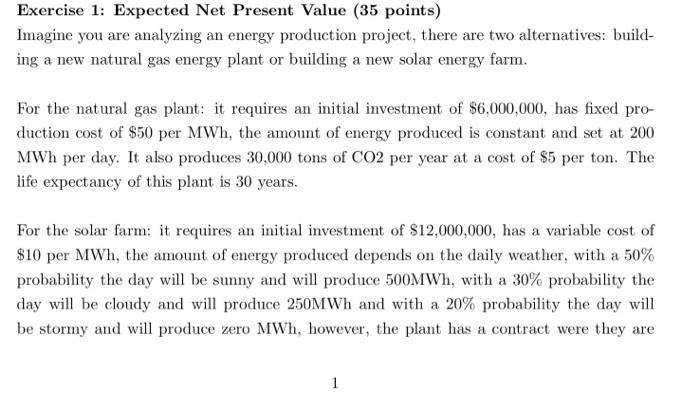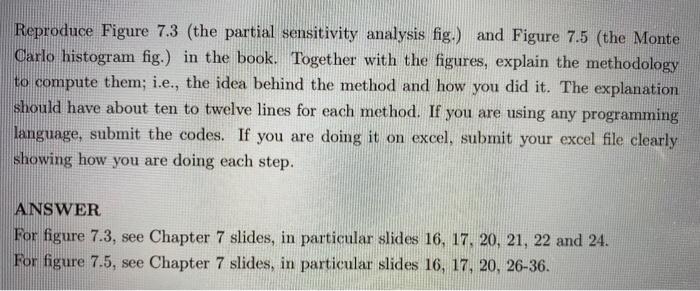
Reproduce Figure 7.3 (the partial sensitivity analysis fig.) and Figure 7.5 (the Monte Carlo histogram fig.) in the book. Together with the figures, explain the methodology to compute them; i.e., the idea behind the method and how you did it. The explanation should have about ten to twelve lines for each method. If you are using any programming language, submit the codes. If you are doing it on excel, submit your excel file clearly showing how you are doing each step. ANSWER For figure 7.3, see Chapter 7 slides, in particular slides 16, 17, 20, 21, 22 and 24. For figure 7.5, see Chapter 7 slides, in particular slides 16, 17, 20, 26-36. Exercise 1: Expected Net Present Value (35 points) Imagine you are analyzing an energy production project, there are two alternatives: build- ing a new natural gas energy plant or building a new solar energy farm. For the natural gas plant: it requires an initial investment of $6,000,000, has fixed pro- duction cost of $50 per MWh, the amount of energy produced is constant and set at 200 MWh per day. It also produces 30,000 tons of CO2 per year at a cost of $5 per ton. The life expectancy of this plant is 30 years. For the solar farm: it requires an initial investment of $12,000,000, has a variable cost of $10 per MWh, the amount of energy produced depends on the daily weather, with a 50% probability the day will be sunny and will produce 500MWh, with a 30% probability the day will be cloudy and will produce 250MWh and with a 20% probability the day will be stormy and will produce zero MWh, however, the plant has a contract were they are Reproduce Figure 7.3 (the partial sensitivity analysis fig.) and Figure 7.5 (the Monte Carlo histogram fig.) in the book. Together with the figures, explain the methodology to compute them; i.e., the idea behind the method and how you did it. The explanation should have about ten to twelve lines for each method. If you are using any programming language, submit the codes. If you are doing it on excel, submit your excel file clearly showing how you are doing each step. ANSWER For figure 7.3, see Chapter 7 slides, in particular slides 16, 17, 20, 21, 22 and 24. For figure 7.5, see Chapter 7 slides, in particular slides 16, 17, 20, 26-36. Exercise 1: Expected Net Present Value (35 points) Imagine you are analyzing an energy production project, there are two alternatives: build- ing a new natural gas energy plant or building a new solar energy farm. For the natural gas plant: it requires an initial investment of $6,000,000, has fixed pro- duction cost of $50 per MWh, the amount of energy produced is constant and set at 200 MWh per day. It also produces 30,000 tons of CO2 per year at a cost of $5 per ton. The life expectancy of this plant is 30 years. For the solar farm: it requires an initial investment of $12,000,000, has a variable cost of $10 per MWh, the amount of energy produced depends on the daily weather, with a 50% probability the day will be sunny and will produce 500MWh, with a 30% probability the day will be cloudy and will produce 250MWh and with a 20% probability the day will be stormy and will produce zero MWh, however, the plant has a contract were they are


