Request to solve the questions: #2, #3, #4. It uses R codes
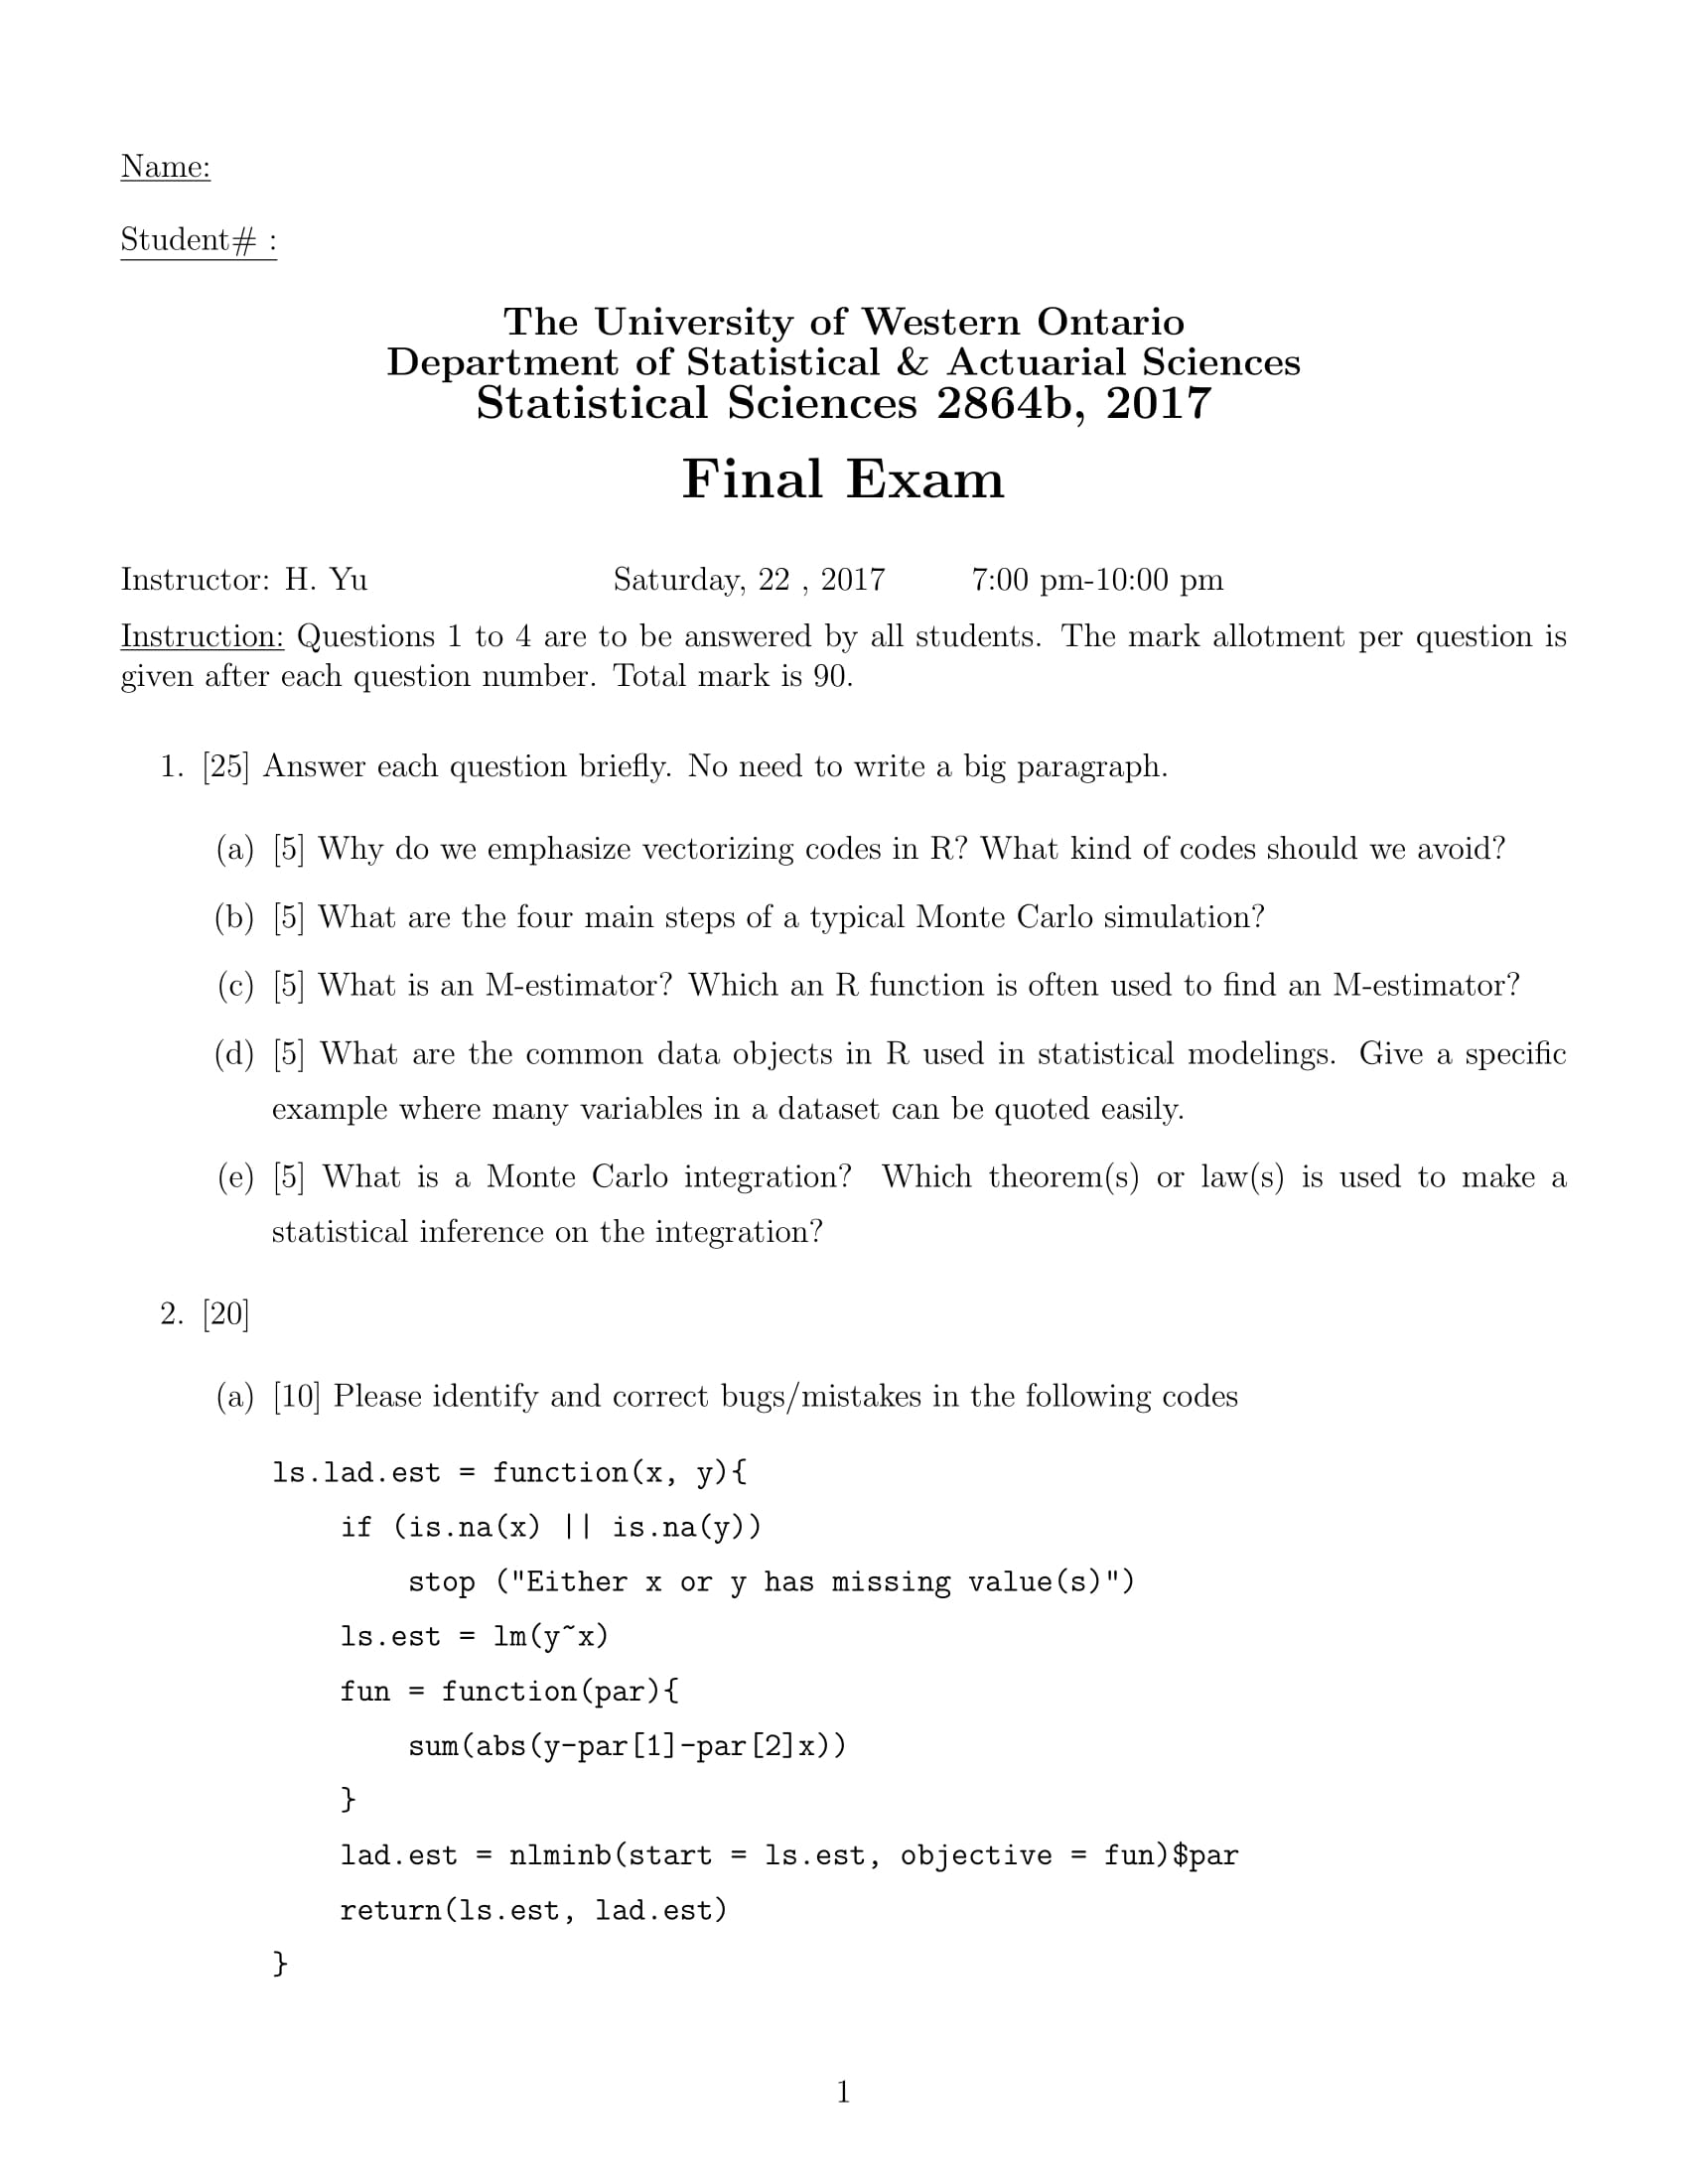
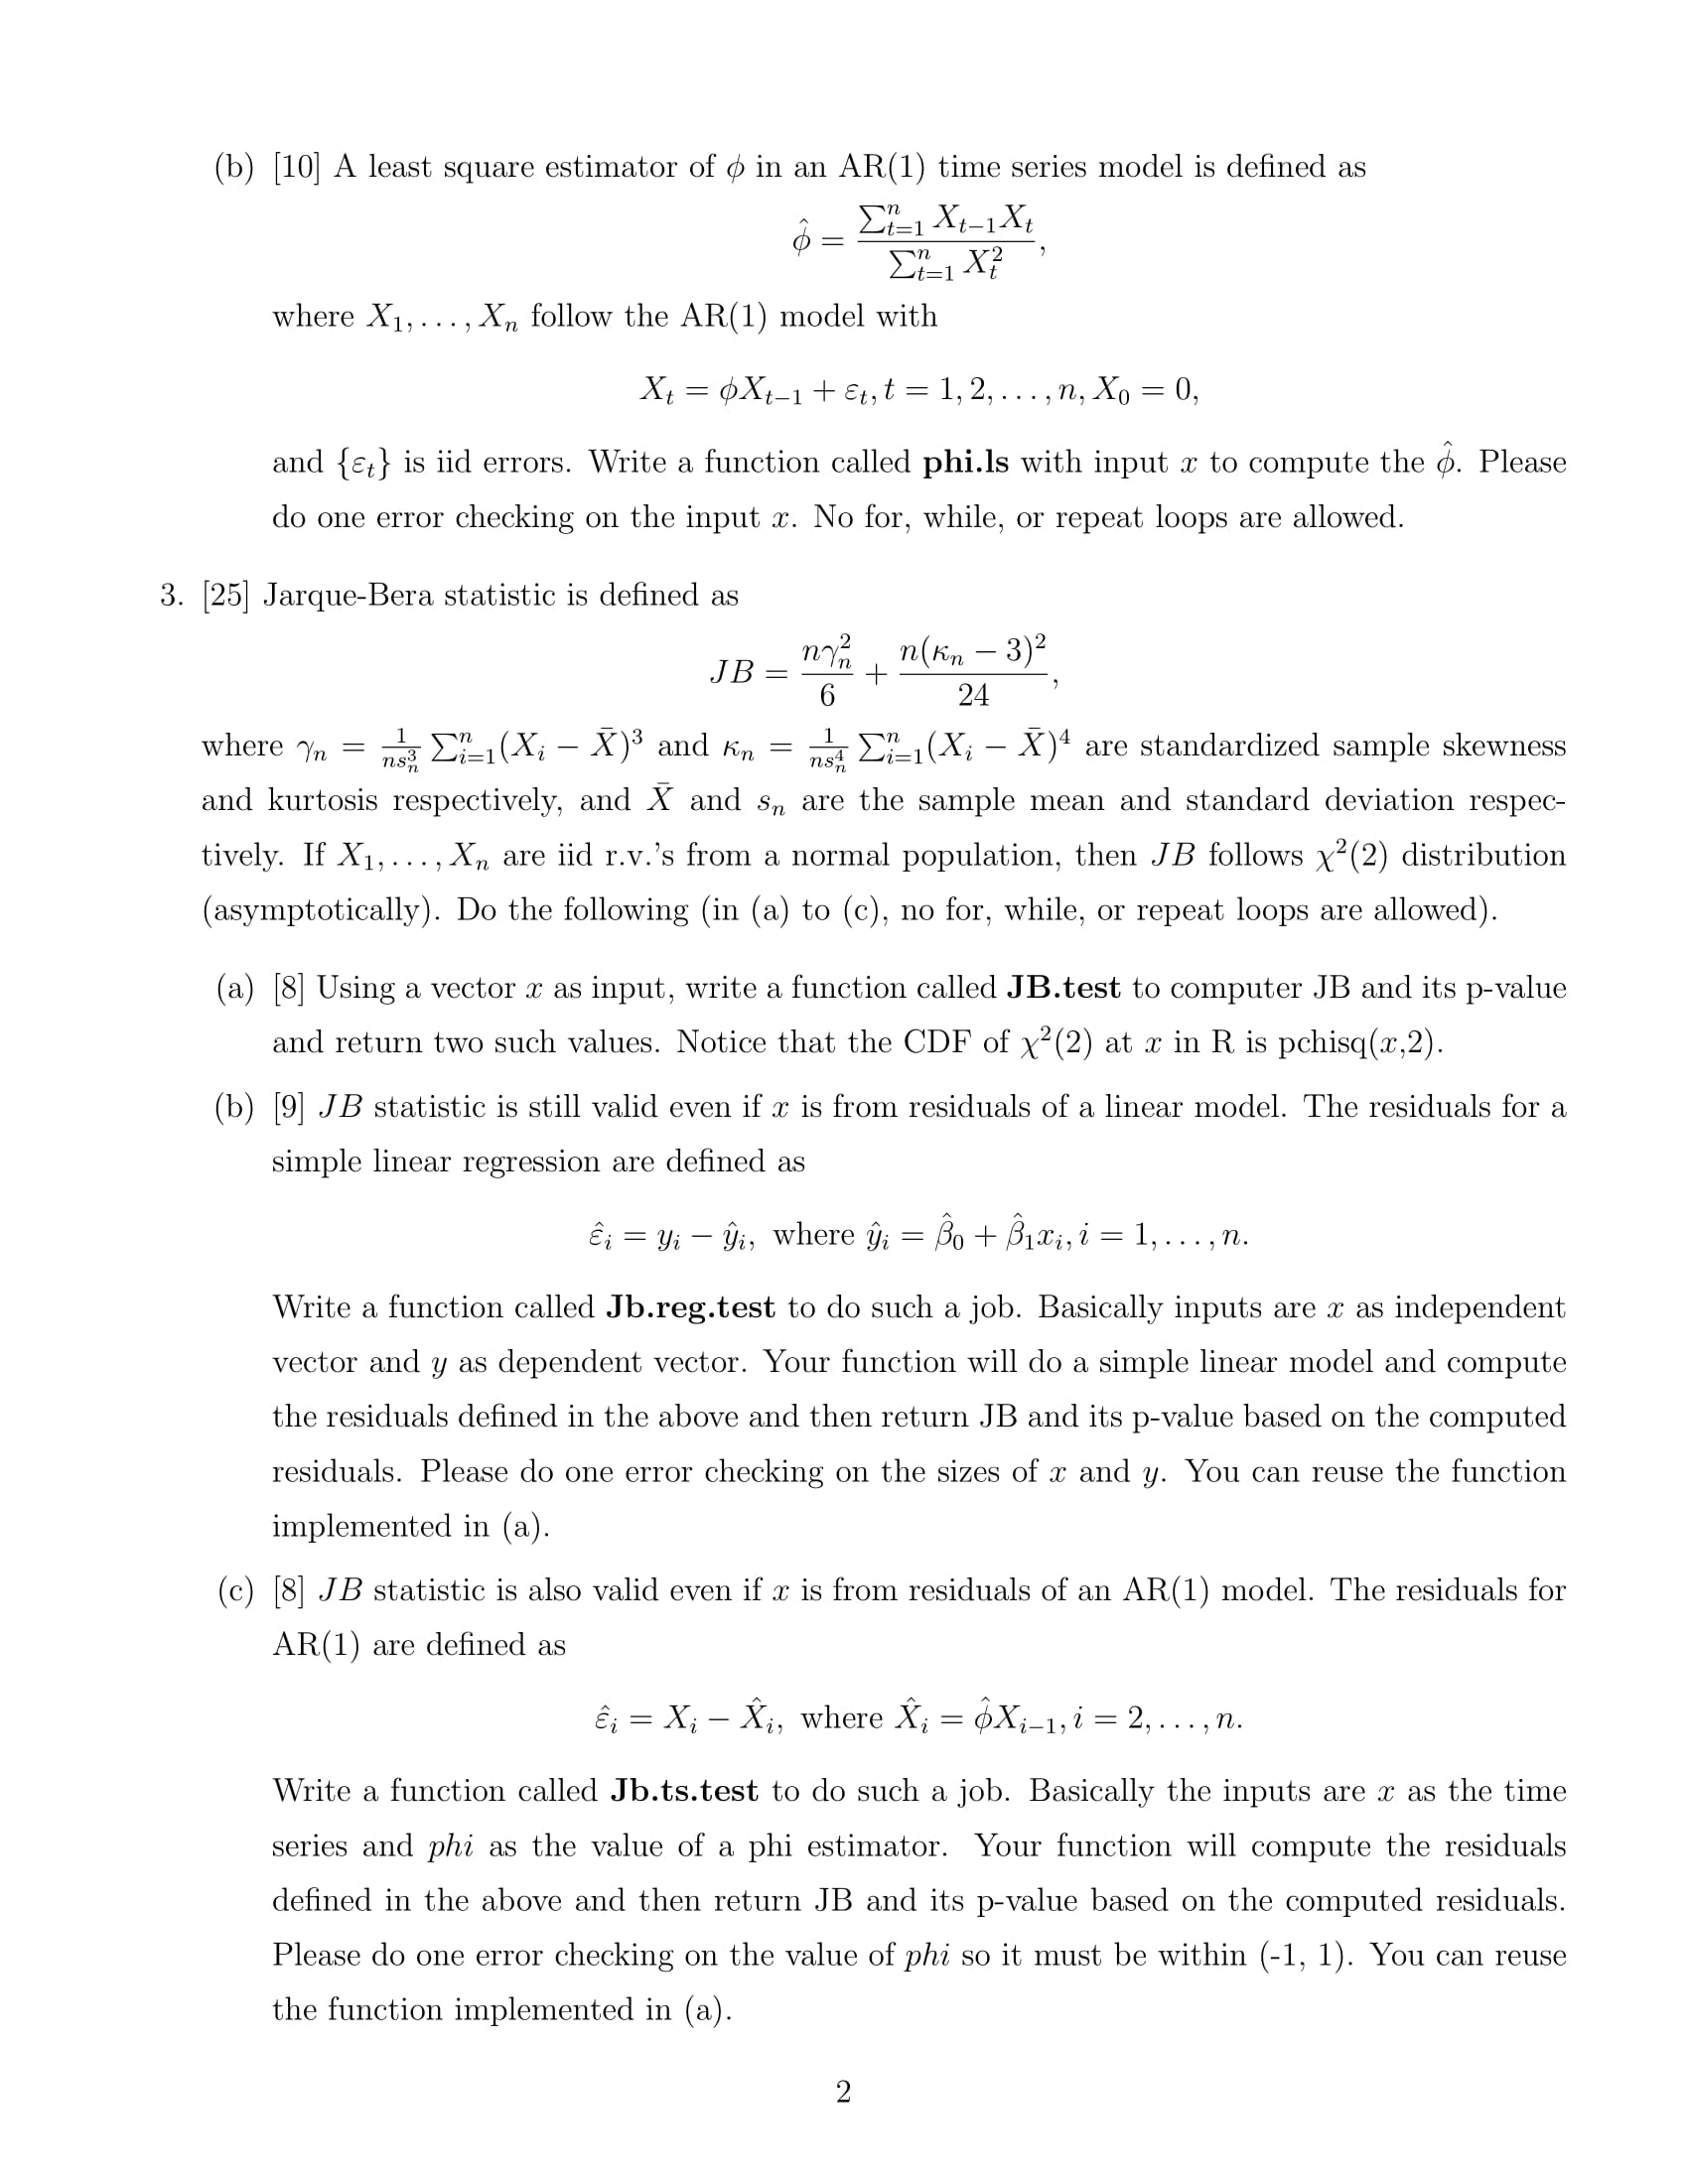
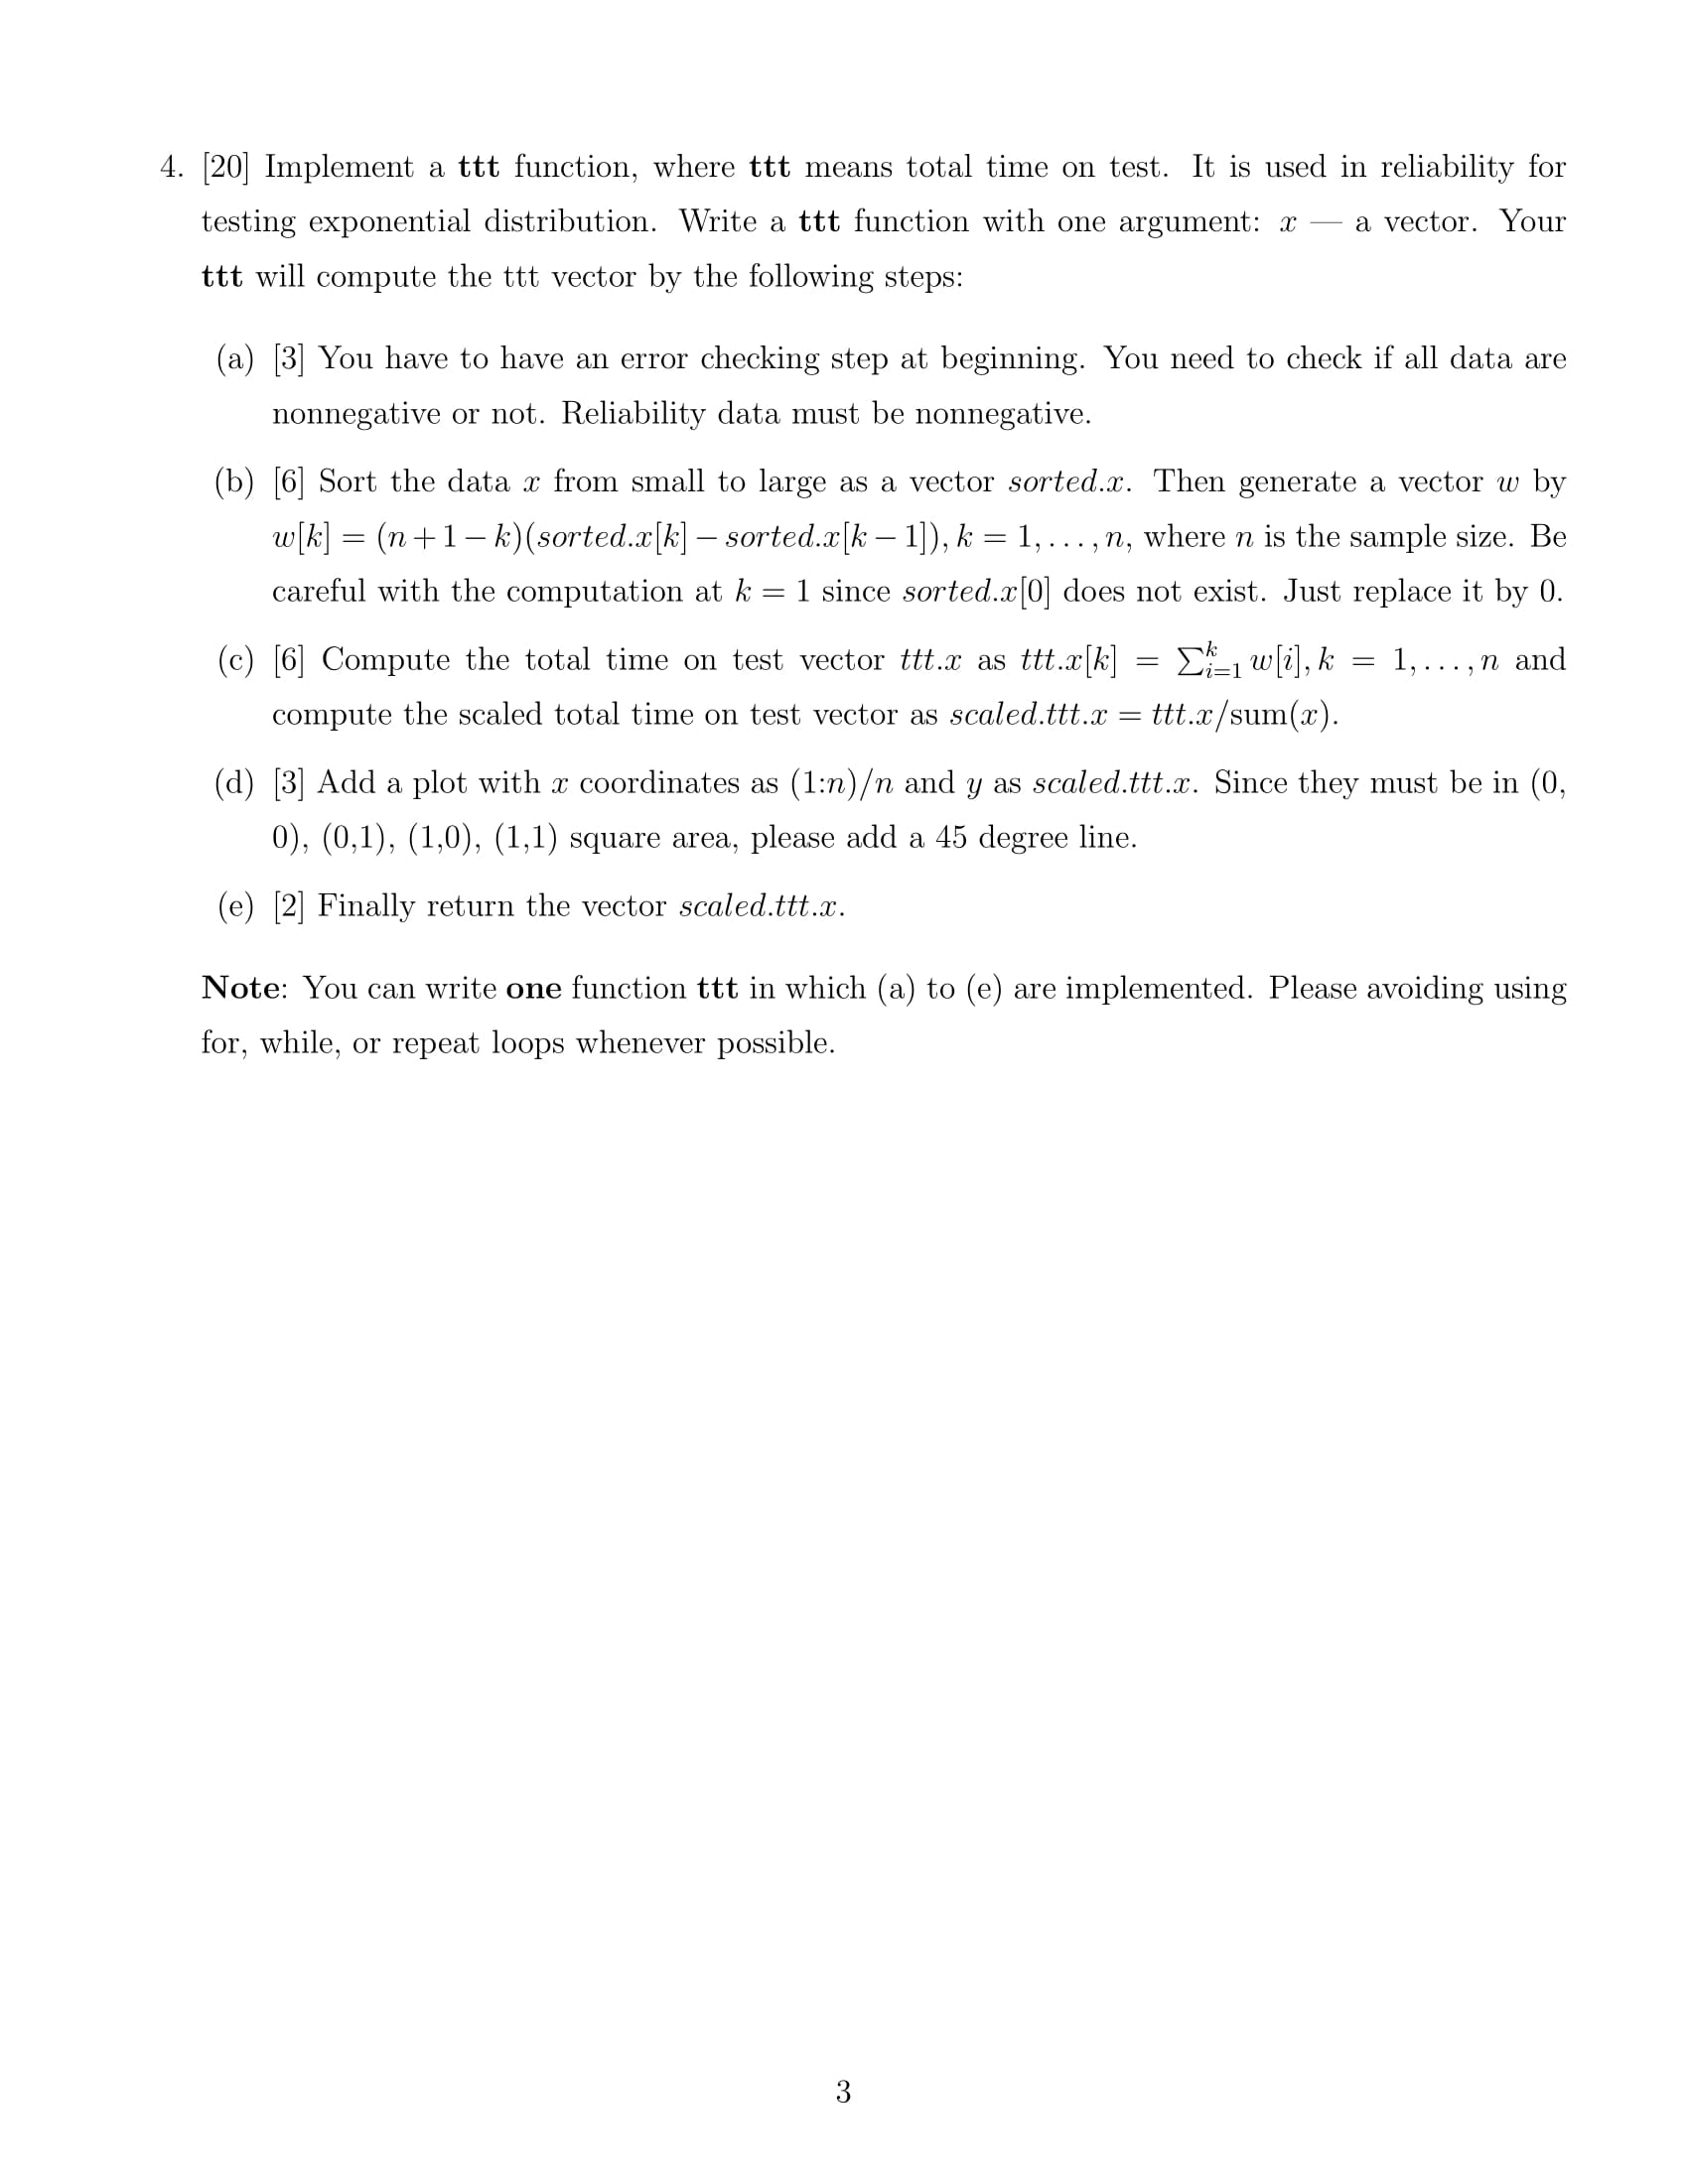
N ame: Student# : The University of Western Ontario Department of Statistical 85 Actuarial Sciences Statistical Sciences 2864b, 2017 Final Exam Instructor: H. Yu Saturday, 22 , 2017 7:00 pm10200 pm Instruction: Questions 1 to 4 are to be answered by all students. The mark allotment per question is given after each question number. Total mark is 90. 1. [25] Answer each question briey. N 0 need to write a big paragraph. (a) [5] Why do we emphasize vectorizing codes in R? What kind of codes should we avoid? (b) [5] What are the four main steps of a typical Monte Carlo simulation? (c) [5] What is an Mestimator? Which an R function is often used to nd an Mestimator? (d) [5] What are the common data objects in R used in statistical modelings. Give a specic example Where many variables in a dataset can be quoted easily. (e) [5] What is a Monte Carlo integration? Which theorem(s) or law(s) is used to make a statistical inference on the integration? 2. [20] (a) [10] Please identify and correct bugs/ mistakes in the following codes ls.lad.est * function(x, y){ if (is.na(x) || is.na(y)) stop ("Either x or y has missing value(s)") ls.est = lmCy\"x) fun function (par) { sumabs (ypar [1] par [2] 30) } lad.est = nlminb(start = ls.est, objective = fun)$par return(ls . est , lad. est) (b) [10] A least square estimator of qt in an ARU) time series model is dened as 3: zaXHXt 2?:1 X3 ' where X1, . . . , X" follow the AR(1) model with Xi2XtI+Etit:1721"'7n7X0:0: and {at} is iid errors. Write a function called phi.ls with input a: to compute the (.3 Please do one error checking on the input :13. No for, while, or repeat loops are allowed. 3. [25] JarqueBera statistic is dened as 2 2 where '7\" 2 E 2?:1(X 503 and an : 221:1(X X)4 are standardized sample skewness and kurtosis respectively, and X and SH are the sample mean and standard deviation respec- tively. If X1, . . . ,Xn are iid r.v.'s from a normal population, then JB follows X2(2) distribution (asymptotically). Do the following (in (a) to (c), no for, while, or repeat loops are allowed). (a) [8] Using a vector x as input, write a function called J B.test to computer J B and its pvalue and return two such values. Notice that the CDF 0f X2(2) at a: in R is pchisq(a:,2). (b) [9] J B statistic is still valid even if it is from residuals of a linear model. The residuals for a simple linear regression are dened as 5i = 112' 92': where 171' = 180 +51$ii7 = lawn\"- Write a function called J b.reg.test to do such a job. Basically inputs are or as independent vector and y as dependent vector. Your function will do a simple linear model and compute the residuals dened in the above and then return J B and its pvalue based on the computed residuals. Please do one error checking on the sizes of :r and y. You can reuse the function implemented in (a), (c) [8] J B statistic is also valid even if m is from residuals of an AR(1) model. The residuals for AR(1) are dened as EA} = Xi X1', where Xi =CXi_1,?; = 2,...,'I'L. Write a function called Jb.ts.test to do such a job. Basically the inputs are at: as the time series and phi as the value of a phi estimator. Your function will compute the residuals dened in the above and then return J B and its pwvalue based on the computed residuals. Please do one error checking on the value of phi so it must be within (-1, 1). You can reuse the function implemented in (a). 4. [20] Implement a ttt function, where ttt means total time on test. It is used in reliability for testing exponential distribution. Write a ttt function With one argument: at 7 a vector. Your ttt will compute the ttt vector by the following steps: (a) [3] You have to have an error checking step at beginning. You need to check if all data are nonnegative or not. Reliability data must be nonnegative. (b) [6] Sort the data m from small to large as a vector sortedm. Then generate a vector w by wlk] = (TL-l- 1 k)(sorted.a:[k] sorted.$[k 1]), k = 1, . . . , n, where n is the sample size. Be careful with the computation at k = 1 since sorted.:1:[0] does not exist. Just replace it by 0. c 6 Compute the total time on test vector ttta as tit;r k = 21-\": w i ,k = 1, . . . ,n and 1, 1 compute the scaled total time on test vector as scaledittm = tit.;t/sum(:r). (d) [3] Add a plot with a: coordinates as (1:n) and y as scaledittm. Since they must be in (U, 0), (0,1), (1,0), (1,1) square area, please add a 45 degree line. (6) [2] Finally return the vector scaledtw. Note: You can write one function ttt in Which (a) to (e) are implemented. Please avoiding using for, While, or repeat loops Whenever possible


