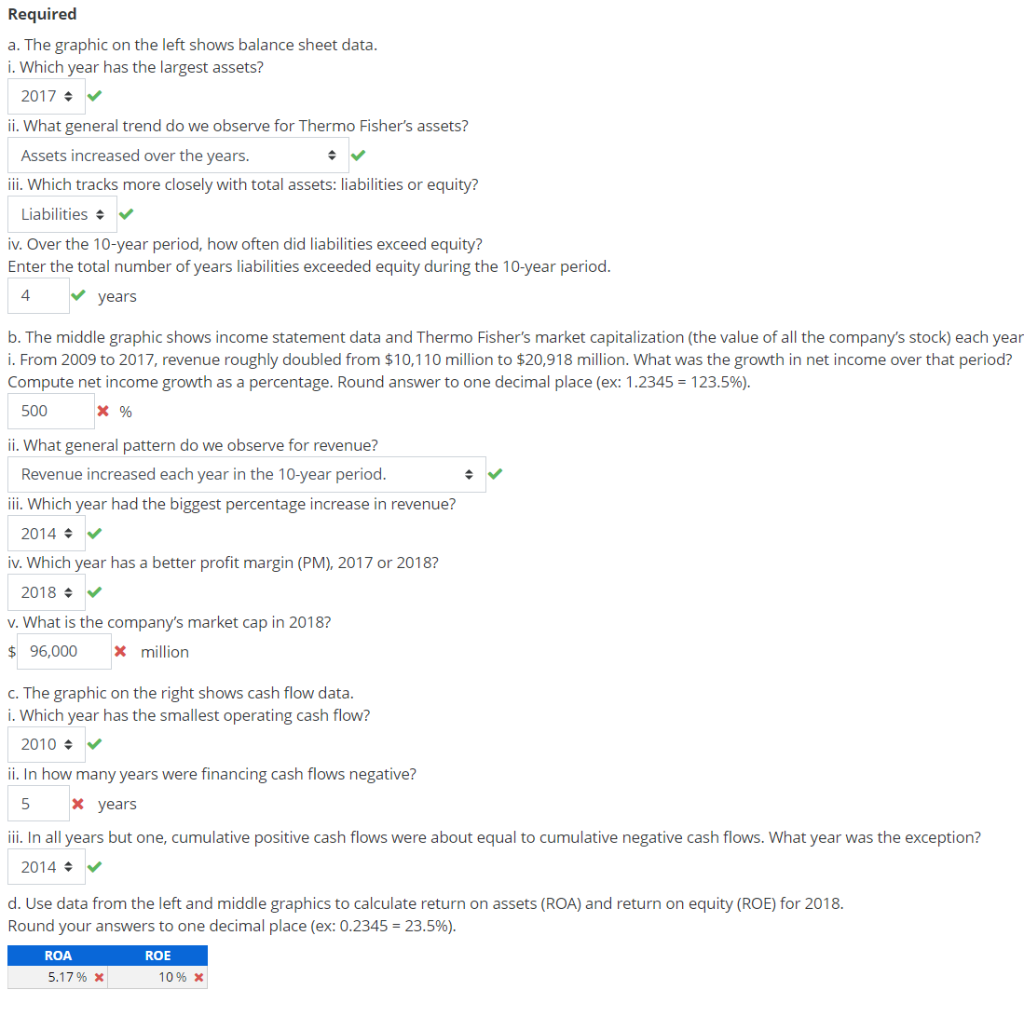
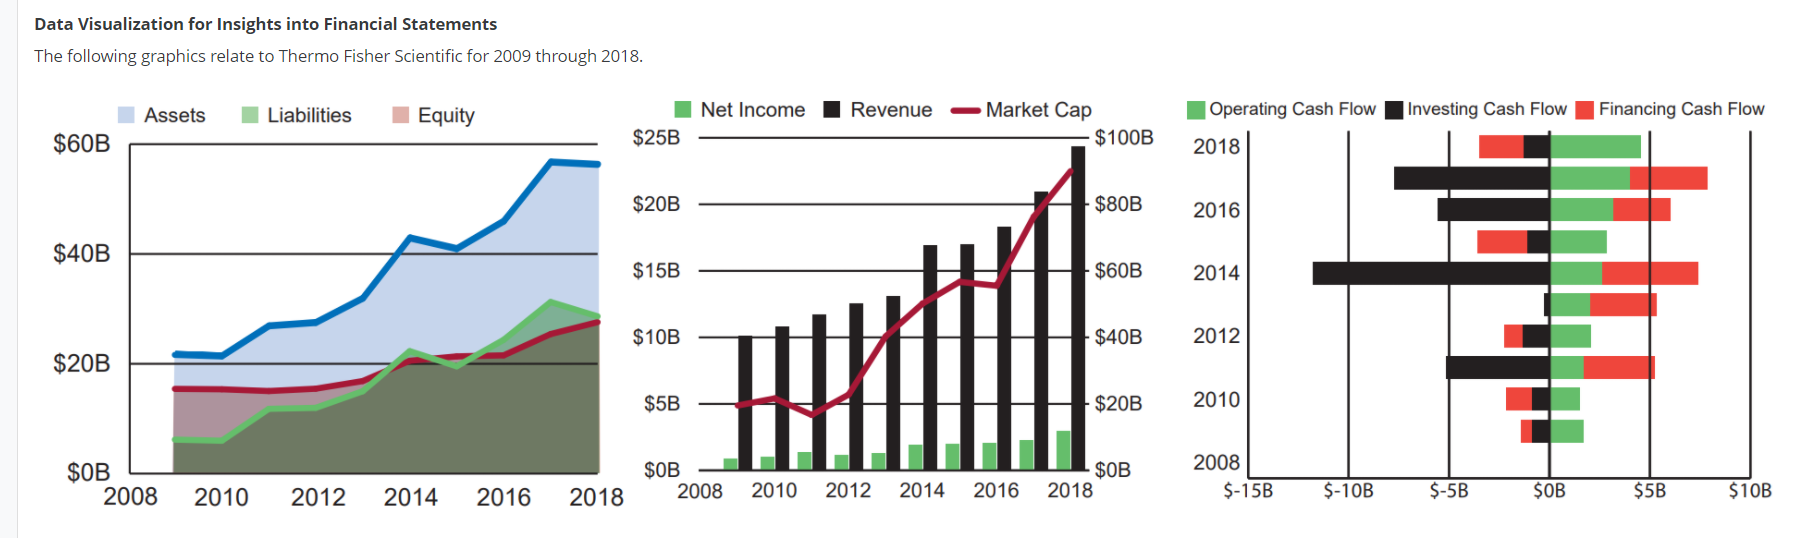
Required a. The graphic on the left shows balance sheet data. i. Which year has the largest assets? 2017 ii. What general trend do we observe for Thermo Fisher's assets? Assets increased over the years. iii. Which tracks more closely with total assets: liabilities or equity? Liabilities iv. Over the 10-year period, how often did liabilities exceed equity? Enter the total number of years liabilities exceeded equity during the 10-year period. 4 years b. The middle graphic shows income statement data and Thermo Fisher's market capitalization (the value of all the company's stock) each year i. From 2009 to 2017, revenue roughly doubled from $10,110 million to $20,918 million. What was the growth in net income over that period? Compute net income growth as a percentage. Round answer to one decimal place (ex: 1.2345 = 123.5%). 500 X % ii. What general pattern do we observe for revenue? Revenue increased each year in the 10-year period. iii. Which year had the biggest percentage increase in revenue? 2014 iv. Which year has a better profit margin (PM), 2017 or 2018? 2018 v. What is the company's market cap in 2018? $ 96,000 * million C. The graphic on the right shows cash flow data. i. Which year has the smallest operating cash flow? 2010 ii. In how many years were financing cash flows negative? 5 x years iii. In all years but one, cumulative positive cash flows were about equal to cumulative negative cash flows. What year was the exception? 2014 d. Use data from the left and middle graphics to calculate return on assets (ROA) and return on equity (ROE) for 2018. Round your answers to one decimal place (ex: 0.2345 = 23.5%). ROA 5.17% x ROE 10% X Data Visualization for Insights into Financial Statements The following graphics relate to Thermo Fisher Scientific for 2009 through 2018. Assets Liabilities Equity Net Income Revenue Operating Cash Flow Investing Cash Flow Market Cap $100B Financing Cash Flow $60B $25B 2018 $20B $80B 2016 $40B $15B $60B 2014 $10B $40B 2012 $20B $5B $20B 2010 $OB 2008 $OB 2008 $OB 2018 2008 $-15B 2010 2012 2014 2016 2018 2010 2012 2014 2016 $-10B $-5B $OB $5B $10B Required a. The graphic on the left shows balance sheet data. i. Which year has the largest assets? 2017 ii. What general trend do we observe for Thermo Fisher's assets? Assets increased over the years. iii. Which tracks more closely with total assets: liabilities or equity? Liabilities iv. Over the 10-year period, how often did liabilities exceed equity? Enter the total number of years liabilities exceeded equity during the 10-year period. 4 years b. The middle graphic shows income statement data and Thermo Fisher's market capitalization (the value of all the company's stock) each year i. From 2009 to 2017, revenue roughly doubled from $10,110 million to $20,918 million. What was the growth in net income over that period? Compute net income growth as a percentage. Round answer to one decimal place (ex: 1.2345 = 123.5%). 500 X % ii. What general pattern do we observe for revenue? Revenue increased each year in the 10-year period. iii. Which year had the biggest percentage increase in revenue? 2014 iv. Which year has a better profit margin (PM), 2017 or 2018? 2018 v. What is the company's market cap in 2018? $ 96,000 * million C. The graphic on the right shows cash flow data. i. Which year has the smallest operating cash flow? 2010 ii. In how many years were financing cash flows negative? 5 x years iii. In all years but one, cumulative positive cash flows were about equal to cumulative negative cash flows. What year was the exception? 2014 d. Use data from the left and middle graphics to calculate return on assets (ROA) and return on equity (ROE) for 2018. Round your answers to one decimal place (ex: 0.2345 = 23.5%). ROA 5.17% x ROE 10% X Data Visualization for Insights into Financial Statements The following graphics relate to Thermo Fisher Scientific for 2009 through 2018. Assets Liabilities Equity Net Income Revenue Operating Cash Flow Investing Cash Flow Market Cap $100B Financing Cash Flow $60B $25B 2018 $20B $80B 2016 $40B $15B $60B 2014 $10B $40B 2012 $20B $5B $20B 2010 $OB 2008 $OB 2008 $OB 2018 2008 $-15B 2010 2012 2014 2016 2018 2010 2012 2014 2016 $-10B $-5B $OB $5B $10B


