

Answered step by step
Verified Expert Solution
Question
1 Approved Answer
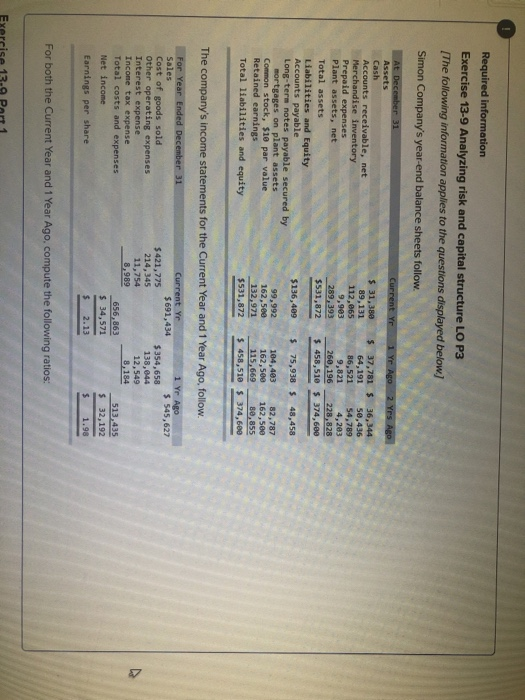
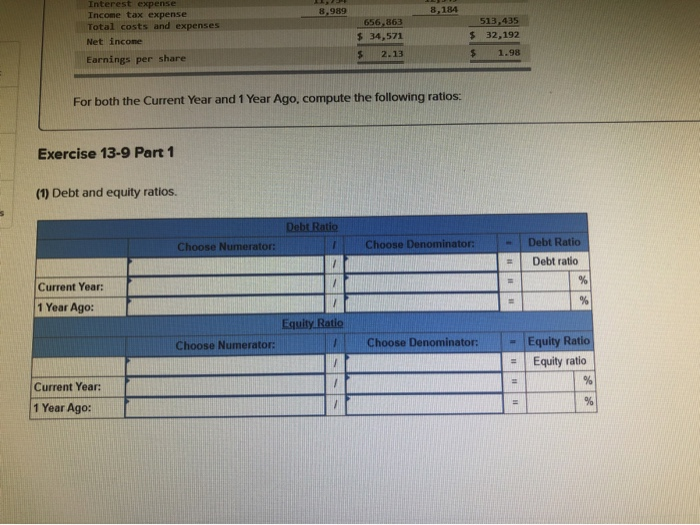
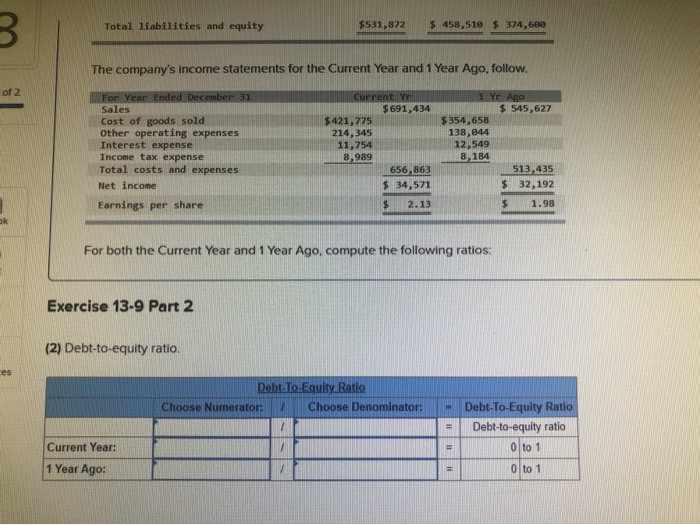
Required information Exercise 13-9 Analyzing risk and capital structure LO P3 [The following information applies to the questions displayed below.) Simon Company's year-end balance sheets
Step by Step Solution
There are 3 Steps involved in it
Step: 1

Get Instant Access to Expert-Tailored Solutions
See step-by-step solutions with expert insights and AI powered tools for academic success
Step: 2

Step: 3
Ace Your Homework with AI
Get the answers you need in no time with our AI-driven, step-by-step assistance
Get Started
Apple Marketing Audit And New Service Product Plan
Authors: Sherry King
1st Edition
3656610797, 978-3656610793