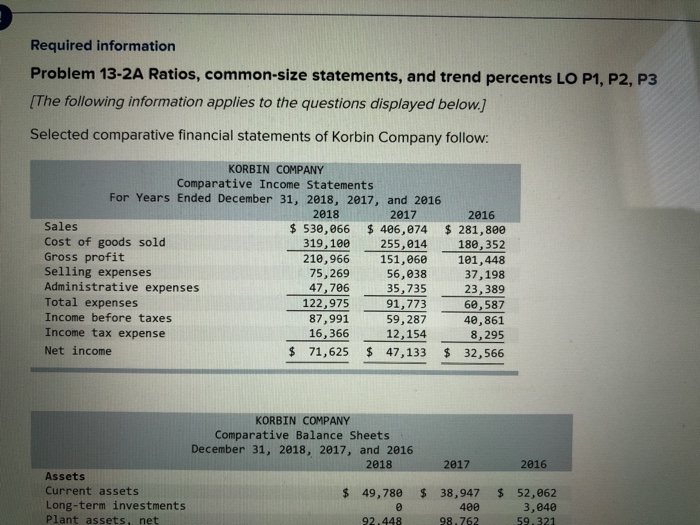
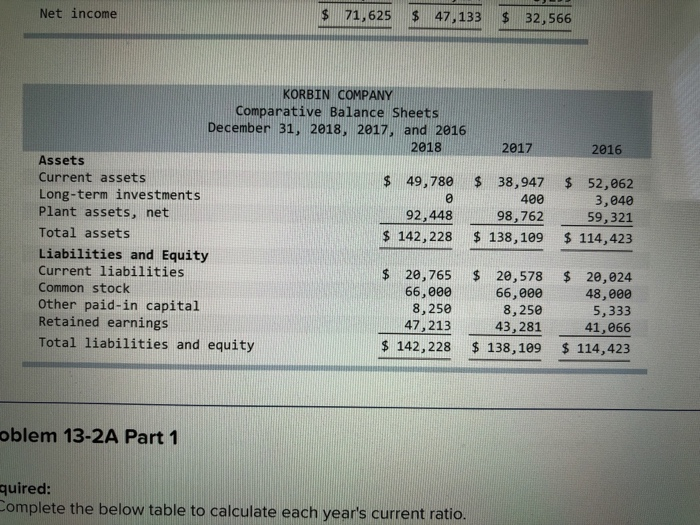
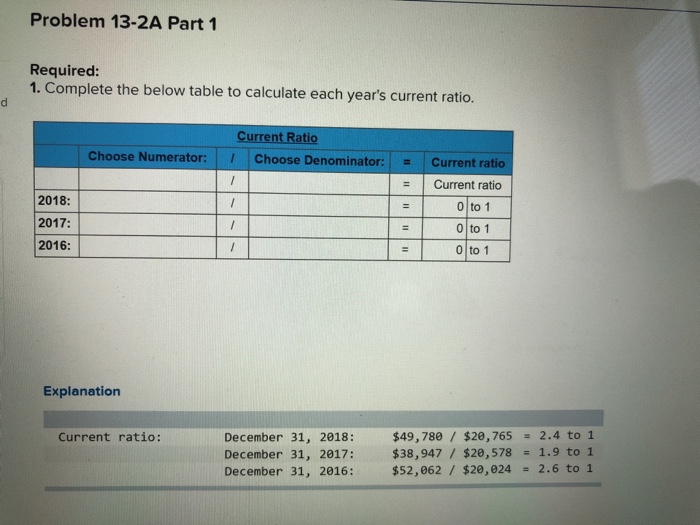
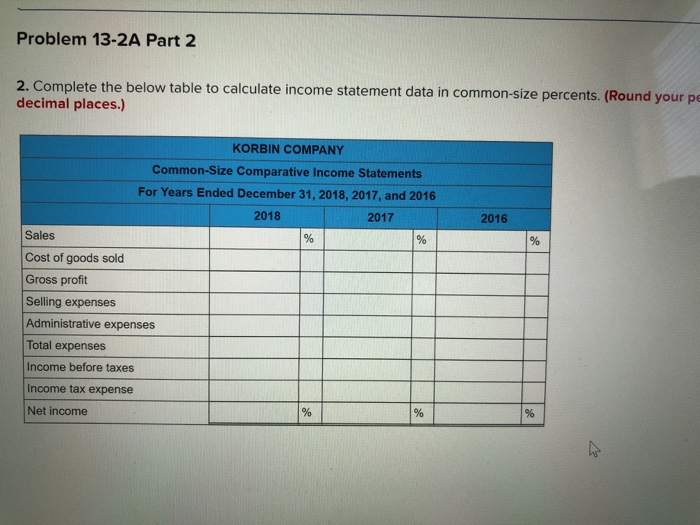
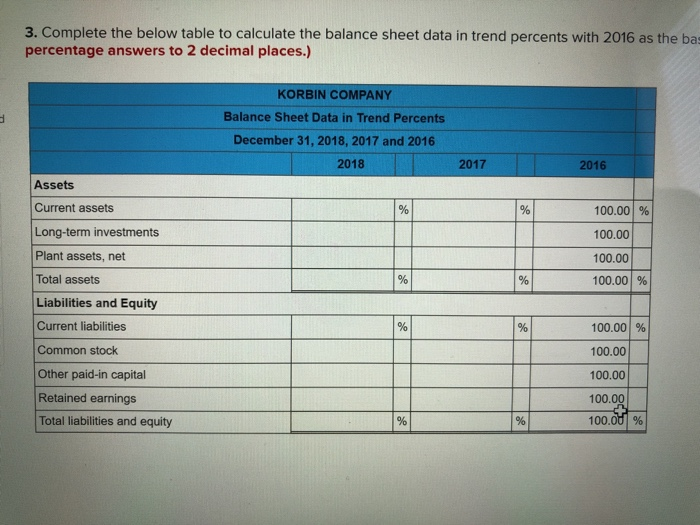
Required information Problem 13-2A Ratios, common-size statements, and trend percents LO P1, P2, P3 [The following information applies to the questions displayed below Selected comparative financial statements of Korbin Company follow: KORBIN COMPANY Comparative Income Statements For Years Ended December 31, 2018, 2017, and 2016 2018 319,100 75,269 2017 530,066 406,074 281,800 2016 Sales Cost of goods sold Gross profit Selling expenses Administrative expenses Total expenses Income before taxes Income tax expense Net income 180, 352 101,448 37,198 23,389 60,587 40,861 8,295 210,966 151,060 56,038 35,735 47,706 91 91,773 SE 122,975 87,991 5 16,366 12,154 59,287 71,625 47,133 $ 32,566 KORBIN COMPANY Comparative Balance Sheets December 31, 2018, 2017, and 2016 2018 2017 2016 Assets Current assets Long-term investments Plant assets, net $ 49,780 38,947 $ 52,062 3,040 59,321 400 98.762 92.448 Net income $ 71,625 $ 47,133 $ 32,566 KORBIN COMPANY Comparative Balance Sheets December 31, 2018, 2017, and 2016 2018 2017 2016 Assets Current assets Long-term investments Plant assets, net Total assets $ 49,780 $38,947 52,062 3,040 98,762592 $ 142,228 $138,109 $114,423 400 92,448 Liabilities and Equity Current liabilities Common stock Other paid-in capital Retained earnings Total liabilities and equity $ 20,765 $20,578 20,024 48,000 5,333 41,066 $ 142,228 138,109 114,423 66,000 8,250 66,000 8,250 47,21343520 43,281 oblem 13-2A Part 1 quired: Complete the below table to calculate each year's current ratio. Problem 13-2A Part 1 Required: 1. Complete the below table to calculate each year's current ratio. Current Ratio hoose Numerator: 1 / Choose Denominator: i = current ratio Current ratio 2018: 2017: 2016 0 to 1 0 to 1 Explanation $49,780/ $20,7652.4 to 1 Current ratio: December 31, 2018: December 31, 2017: $38, 947 / $20,578 1.9 to 1 December 31, 2016: $52,062/ $20,0242.6 to 1 Problem 13-2A Part 2 statement data in common-size percents. (Round your p decimal places.) KORBIN COMPANY Common-Size Comparative Income Statements For Years Ended December 31, 2018, 2017, and 2016 2018 2017 2016 Sales Cost of goods sold Gross profit Selling expenses Administrative expenses Total expenses Income before taxes Income tax expense Net income 3. Complete the below table to calculate the balance sheet data in trend percents with 2016 as the bas percentage answers to 2 decimal places.) KORBIN COMPANY Balance Sheet Data in Trend Percents December 31, 2018, 2017 and 2016 2018 2017 2016 Assets Current assets Long-term investments Plant assets, net Total assets Liabilities and Equity Current liabilities Common stock Other paid-in capital Retained earnings Total liabilities and equity 100.001 % 100.00 100.00 100.001 % 100.001 %! 100.00 100.00 100.00 100.001 %
