Answered step by step
Verified Expert Solution
Link Copied!

Question

1 Approved Answer

Required information Problem 17-1A Ratios, common-size statements, and trend percents LO P1, P2, P3 [The following information applies to the questions displayed below.) Selected comparative
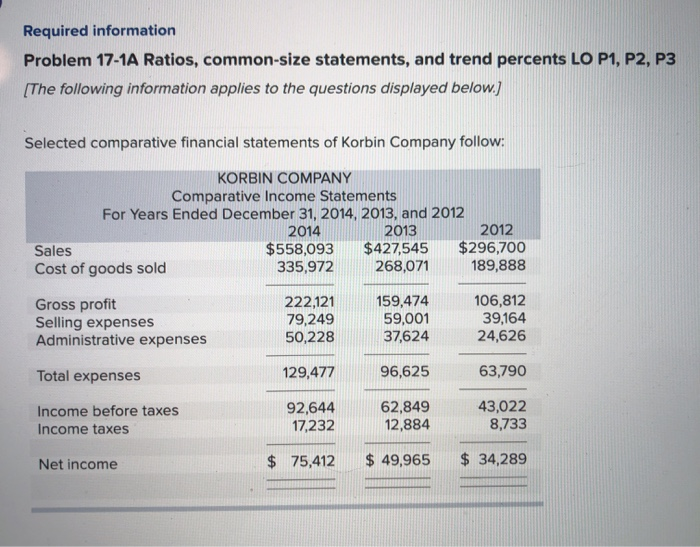
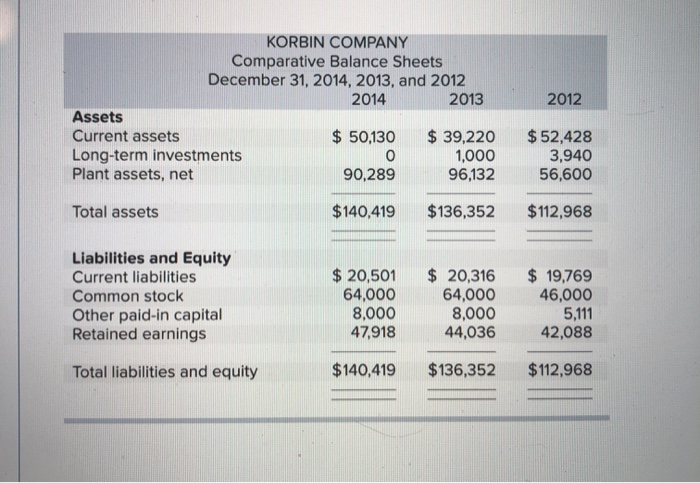
image text in transcribed
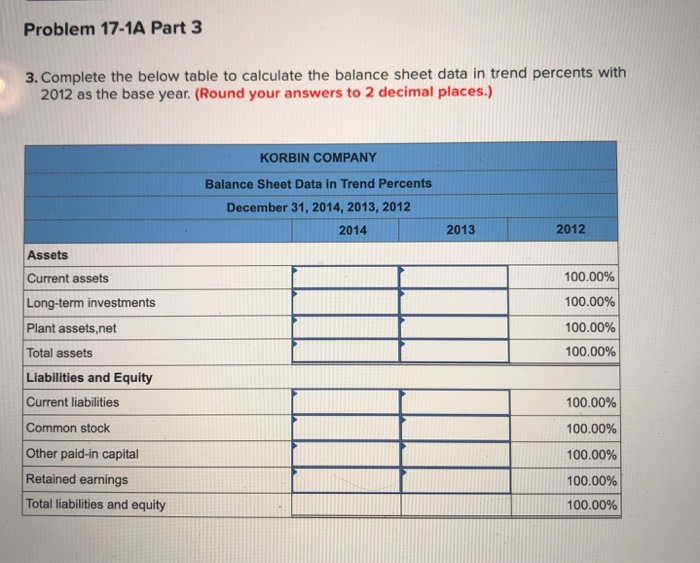
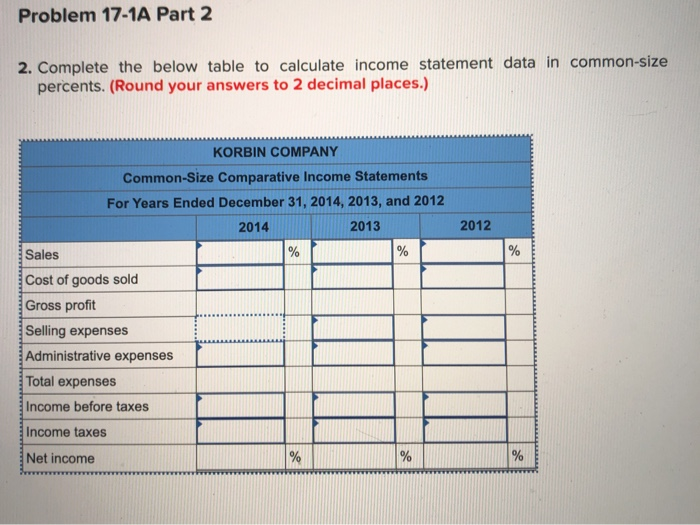
Required information Problem 17-1A Ratios, common-size statements, and trend percents LO P1, P2, P3 [The following information applies to the questions displayed below.) Selected comparative financial statements of Korbin Company follow: KORBIN COMPANY Comparative Income Statements For Years Ended December 31, 2014, 2013, and 2012 2014 2013 2012 Sales $558,093 $427,545 $296,700 Cost of goods sold 335,972 268,071 189,888 Gross profit Selling expenses Administrative expenses 222,121 79,249 50,228 159,474 59,001 37,624 106,812 39,164 24,626 Total expenses 129,477 96,625 63,790 Income before taxes Income taxes 92,644 17,232 62,849 12,884 43,022 8,733 Net income $ 75,412 $ 49,965 $ 34,289 KORBIN COMPANY Comparative Balance Sheets December 31, 2014, 2013, and 2012 2014 2013 Assets Current assets $ 50,130 $ 39,220 Long-term investments 1,000 Plant assets, net 90,289 96,132 2012 $ 52,428 3,940 56,600 Total assets $140,419 $136,352 $112,968 Liabilities and Equity Current liabilities Common stock Other paid-in capital Retained earnings $ 20,501 64,000 8,000 47,918 $ 19,769 46,000 $ 20,316 64,000 8,000 44,036 5,111 42,088 Total liabilities and equity $140,419 $136,352 $112,968 Problem 17-1A Part 2 2. Complete the below table to calculate income statement data in common-size percents. (Round your answers to 2 decimal places.) 2012 KORBIN COMPANY Common-Size Comparative Income Statements For Years Ended December 31, 2014, 2013, and 2012 2014 2013 Sales Cost of goods sold Gross profit Selling expenses Administrative expenses Total expenses Income before taxes Income taxes Net income Problem 17-1A Part 3 3. Complete the below table to calculate the balance sheet data in trend percents with 2012 as the base year. (Round your answers to 2 decimal places.) KORBIN COMPANY Balance Sheet Data in Trend Percents December 31, 2014, 2013, 2012 2014 2013 2012 100.00% 100.00% 100.00% 100.00% Assets Current assets Long-term investments Plant assets, net Total assets Liabilities and Equity Current liabilities Common stock Other paid-in capital Retained earnings Total liabilities and equity 100.00% 100.00% 100.00% N HL 100.00% 100.00%
Step by Step Solution

There are 3 Steps involved in it

Step: 1

blur-text-image

Get Instant Access to Expert-Tailored Solutions

See step-by-step solutions with expert insights and AI powered tools for academic success

Step: 2

blur-text-image

Step: 3

blur-text-image

Ace Your Homework with AI

Get the answers you need in no time with our AI-driven, step-by-step assistance

Get Started

Recommended Textbook for

Management Audit A Complete Guide

Authors: Gerardus Blokdyk

2020 Edition

0655905413, 978-0655905417

More Books

Students also viewed these Accounting questions

Question

How is Meg Whitman appropriate for a top management team?

Answered: 1 week ago