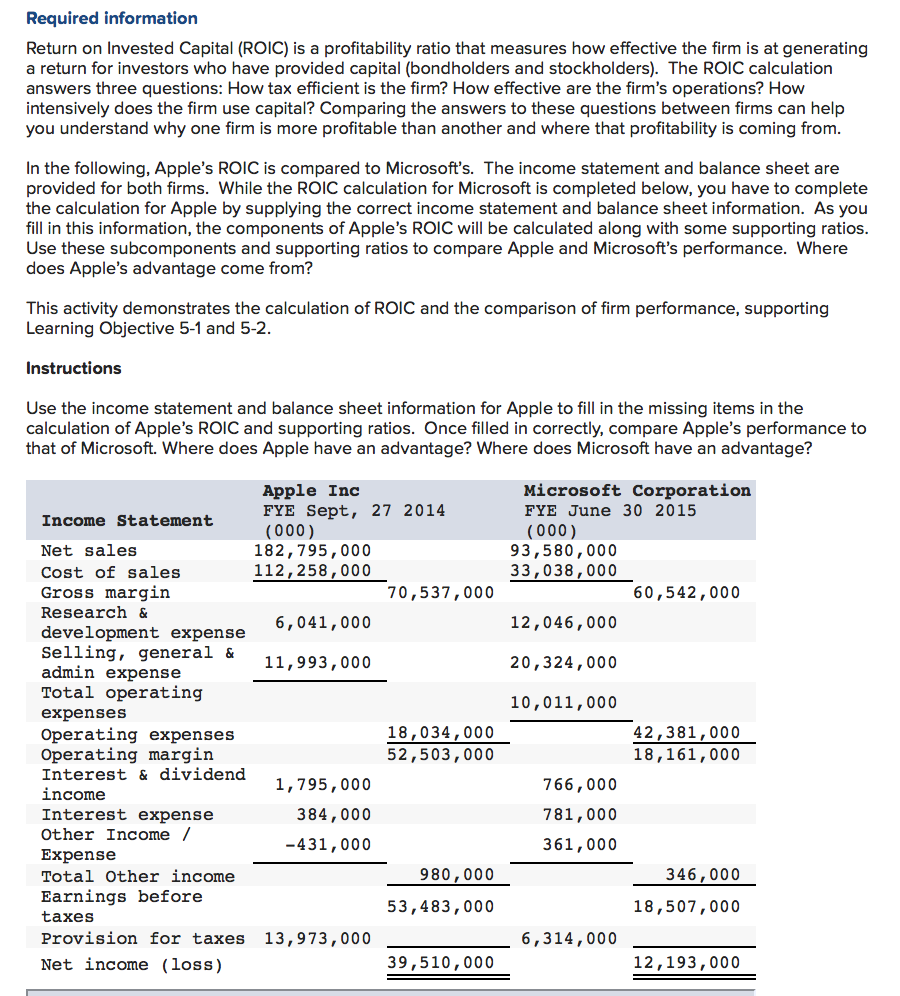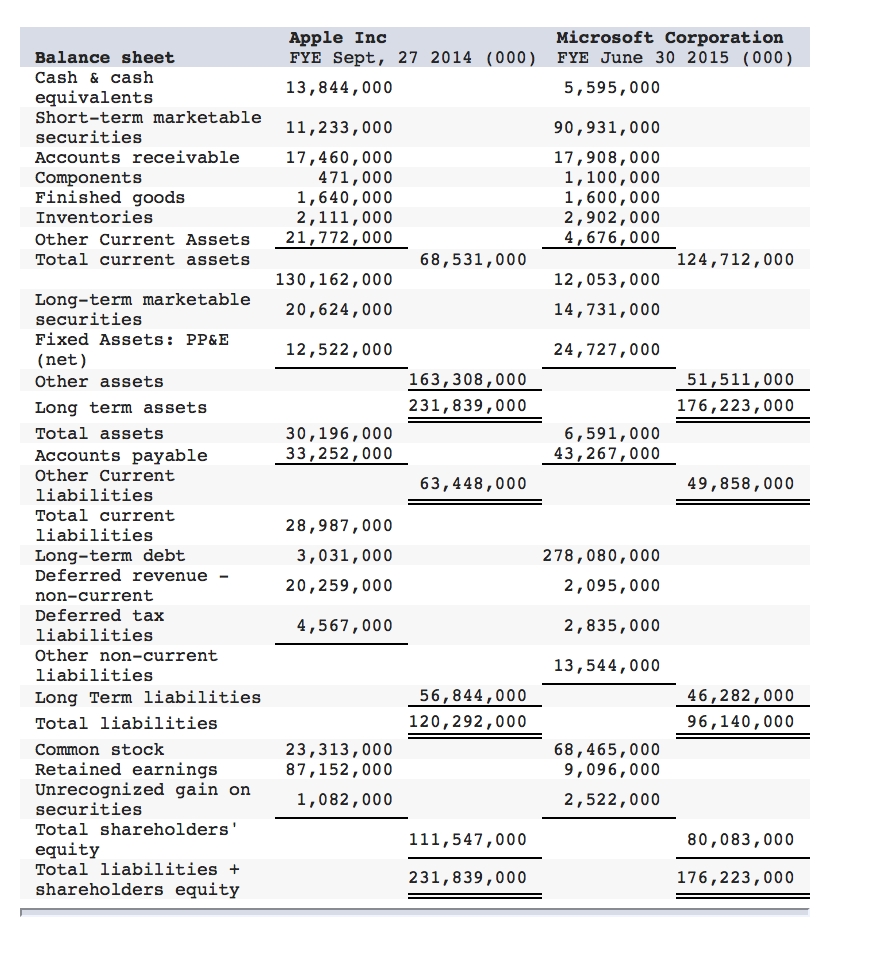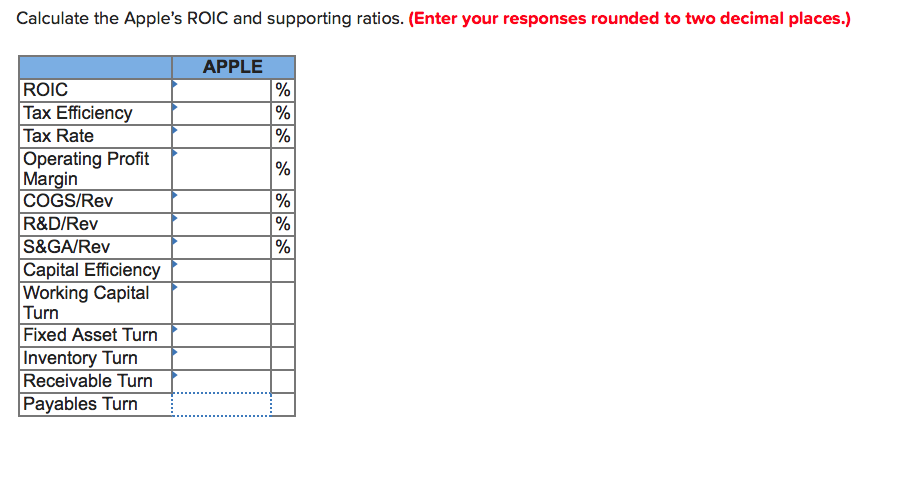


Required information Return on Invested Capital (ROIC) is a profitability ratio that measures how effective the firm is at generating a return for investors who have provided capital (bondholders and stockholders). The ROIC calculation answers three questions: How tax efficient is the firm? How effective are the firm's operations? How intensively does the firm use capital? Comparing the answers to these questions between firms can help you understand why one firm is more profitable than another and where that profitability is coming from. In the following, Apple's ROIC is compared to Microsoft's. The income statement and balance sheet are provided for both firms. While the ROIC calculation for Microsoft is completed below, you have to complete the calculation for Apple by supplying the correct income statement and balance sheet information. As you fill in this information, the components of Apple's ROIC will be calculated along with some supporting ratios. Use these subcomponents and supporting ratios to compare Apple and Microsoft's performance. Where does Apple's advantage come from? This activity demonstrates the calculation of ROIC and the comparison of firm performance, supporting Learning Objective 5-1 and 5-2 Instructions Use the income statement and balance sheet information for Apple to fill in the missing items in the calculation of Apple's ROIC and supporting ratios. Once filled in correctly, compare Apple's performance to that of Microsoft. Where does Apple have an advantage? Where does Microsoft have an advantage? Apple Inc FYE Sept, 27 2014 (000) 182,795,000 112,258,000 Microsoft Corporation FYE June 30 2015 Income Statement (000) 93,580,000 33,038,000 Net sales Cost of sales Gross margin Research & development expense Selling, general & admin expense Total operating expenses Operating expenses Operating margin Interest & dividend income Interest expense Other Income / Expense Total Other income Earnings before taxes Provision for taxes 13,973,000 Net income (loss) 70,537,000 60,542,000 6,041,000 12,046,000 20,324,000 10,011, 000 11,993,000 18,034,000 52,503,000 42,381,000 18,161, 000 1,795,000 384,000 431,000 766,000 781,000 361,000 980,000 346,000 53,483,000 18,507,000 6,314,000 39,510,000 12,193,000


