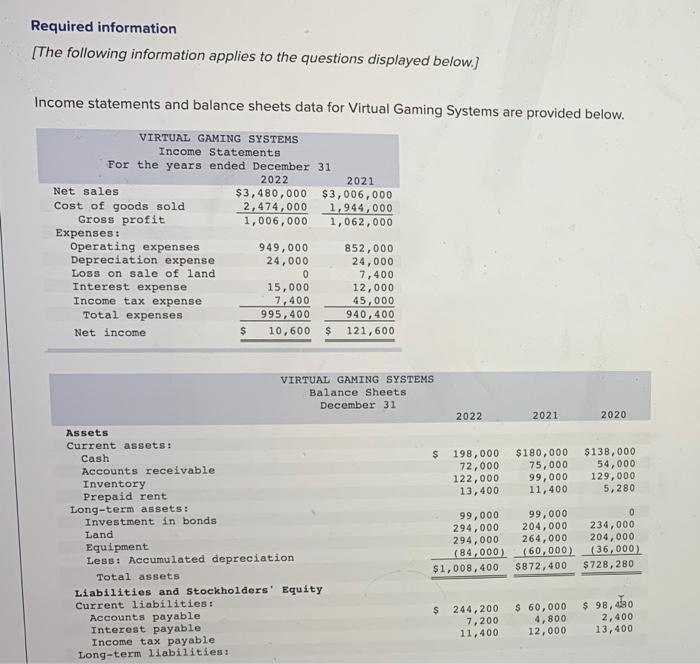
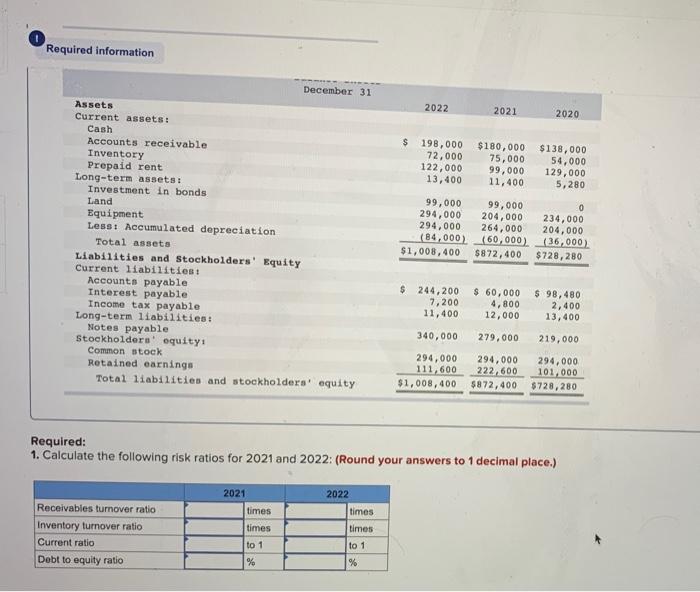
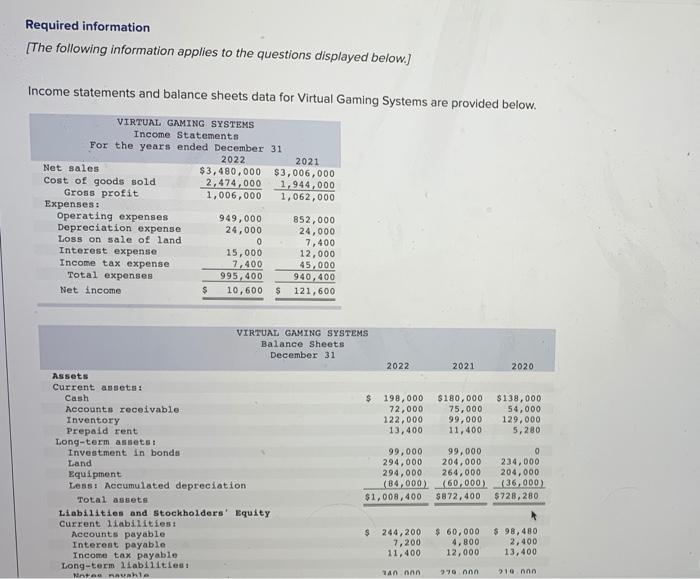
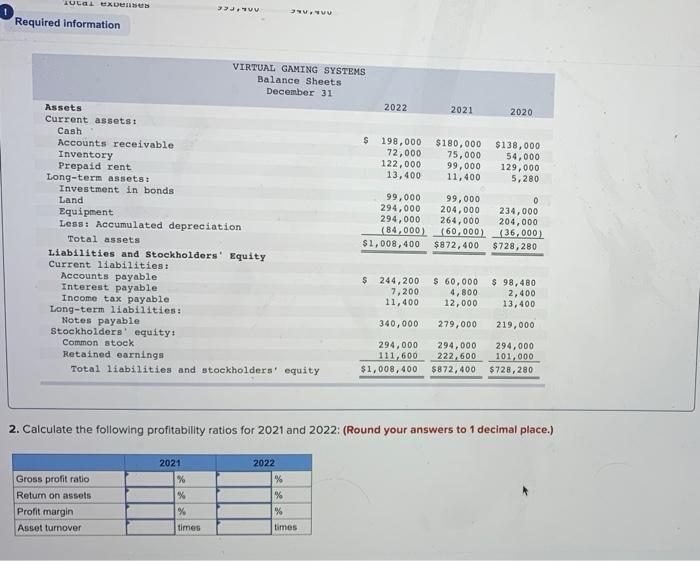
Required information [The following information applies to the questions displayed below.) Income statements and balance sheets data for Virtual Gaming Systems are provided below. VIRTUAL GAMING SYSTEMS Income Statements For the years ended December 31 2022 2021 Net sales $3,480,000 $3,006,000 Cost of goods sold 2,474,000 1,944,000 Gross profit 1,006,000 1,062,000 Expenses : Operating expenses 949,000 852,000 Depreciation expense 24,000 24,000 LOSS on sale of land 0 7,400 Interest expense 15,000 12,000 Income tax expense 7,400 45,000 Total expenses 995,400 940,400 Net income $ 10,600 $ 121,600 VIRTUAL GAMING SYSTEMS Balance Sheets December 31 2022 2021 2020 $ 198,000 72,000 122,000 13,400 $180,000 75,000 99,000 11,400 $ 138,000 54,000 129,000 5,280 Assets Current assets: Cash Accounts receivable Inventory Prepaid rent Long-term assets: Investment in bonds Land Equipment Less: Accumulated depreciation Total assets Liabilities and Stockholders' Equity Current liabilities: Accounts payable Interest payable Income tax payable Long-term liabilities: 99,000 294,000 294,000 (84,000) $1,008,400 99,000 204,000 264,000 (60,000) $872,400 0 234,000 204,000 (36,000) $728,280 $ 98,420 $ 244,200 7,200 11,400 $ 60,000 4,800 12,000 2,400 13,400 Required information December 31 2022 2021 2020 $ 198,000 72,000 122,000 13,400 $180,000 75,000 99,000 11,400 $ 138,000 54,000 129,000 5,280 Assets Current assets: Cash Accounts receivable Inventory Prepaid rent Long-term assets: Investment in bonds Land Equipment Less: Accumulated depreciation Total assets Liabilities and Stockholders' Equity Current liabilities: Accounts payable Interest payable Income tax payable Long-term liabilities: Notes payable Stockholders' equity Common stock Retained earnings Total liabilities and stockholders' equity 99,000 294,000 294,000 (84,000) $1,008,400 99,000 204,000 264,000 (60.000) $872,400 0 234,000 204,000 (36,000) $728,280 $ 244,200 7,200 11,400 $ 60,000 4,800 12,000 $ 98,480 2,400 13,400 340,000 279.000 219,000 294,000 111,600 $1,008,400 294,000 222,600 $872,400 294,000 101,000 $728, 280 Required: 1. Calculate the following risk ratios for 2021 and 2022: (Round your answers to 1 decimal place.) 2021 times Receivables turnover ratio Inventory turnover ratio Current ratio Debt to equity ratio times to 1 % 2022 times times to 1 % Required information [The following information applies to the questions displayed below.) Income statements and balance sheets data for Virtual Gaming Systems are provided below. VIRTUAL GAMING SYSTEMS Income Statements For the years ended December 31 2022 2021 Net sales $3,480,000 $3,006,000 Cost of goods sold 2,474,000 1,944,000 Gross profit 1,006,000 1,062,000 Expenses: Operating expenses 949,000 852,000 Depreciation expense 24,000 24,000 Loss on sale of land 0 7,400 Interest expense 15,000 12,000 Income tax expense 7,400 45,000 Total expenses 995,400 940,400 Net income $ 10,600 $ 121,600 VIRTUAL GAMING SYSTEMS Balance Sheets December 31 2022 2021 2020 $ 198,000 72,000 122.000 13,400 $180,000 $138,000 75,000 54,000 99,000 129,000 11,400 5,280 Assets Current assets: Cash Accounts receivable Inventory Prepaid rent Long-term assets: Investment in bonds Land Equipment Less: Accumulated depreciation Total assets Liabilities and Stockholders' Equity Current liabilities: Accounts payable Interest payable Income tax payable Long-term liabilities Notas nasale 99,000 294,000 294,000 (84,000) $1,008,400 99,000 0 204,000 234.000 264,000 204,000 (60.000) (36,000) $872,400 $728, 280 $ 244,200 7,200 11,400 $ 60,000 4,800 12,000 $ 98,480 2,400 13,400 100 nan 970 19 non TULOL XDens N. Required information VIRTUAL GAMING SYSTEMS Balance Sheets December 31 2022 2021 2020 $ 198,000 72,000 122,000 13,400 $180,000 75,000 99,000 11,400 $138,000 54,000 129,000 5,280 Assets Current assets: Cash Accounts receivable Inventory Prepaid rent Long-term assets Investment in bonds Land Equipment Less: Accumulated depreciation Total assets Liabilities and Stockholders' Equity Current liabilities: Accounts payable Interest payable Income tax payable Long-term liabilities: Notes payable Stockholders' equity : Common stock Retained earnings Total liabilities and stockholders' equity 99,000 99,000 294,000 204,000 294,000 264,000 (B4,000) (60,000) $1,008,400 $872,400 0 234,000 204,000 (36,000) $728,280 $ 244,200 7,200 11,400 $ 60,000 4,800 12,000 $ 98,480 2,400 13,400 340,000 279,000 219,000 294,000 111,600 $1,008,400 294,000 222,600 $872,400 294,000 101,000 $728,280 2. Calculate the following profitability ratios for 2021 and 2022: (Round your answers to 1 decimal place.) 2021 % % Gross profit ratio Return on assets Profit margin Asset turnover 2022 % % % % times times