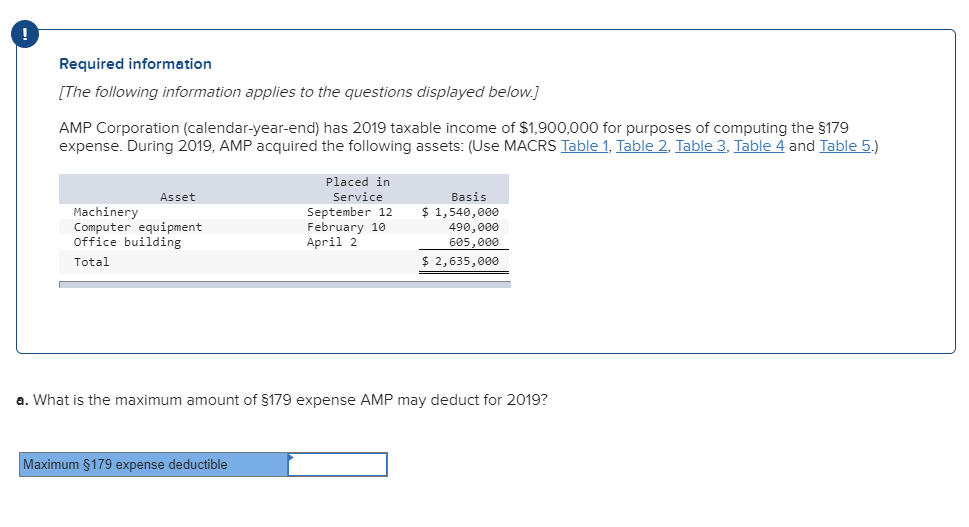
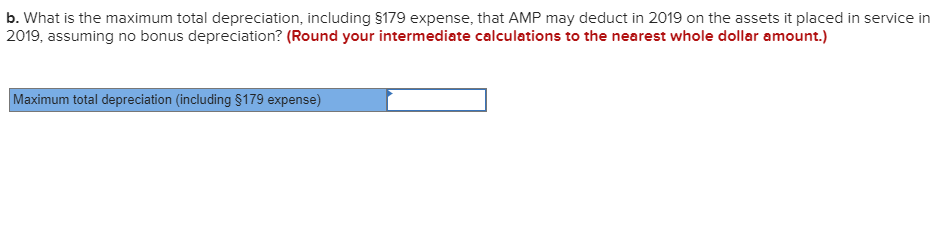
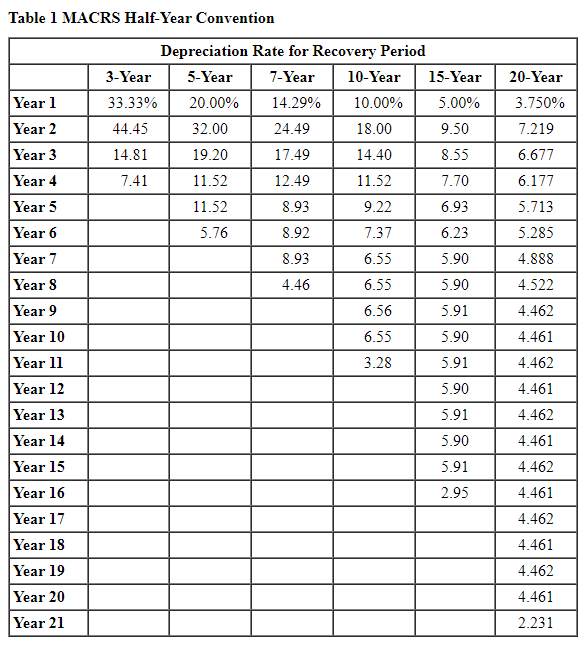
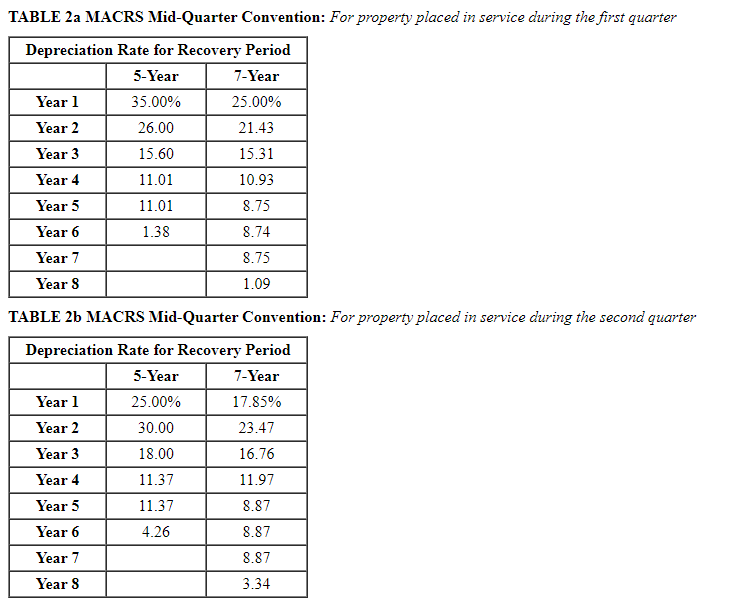
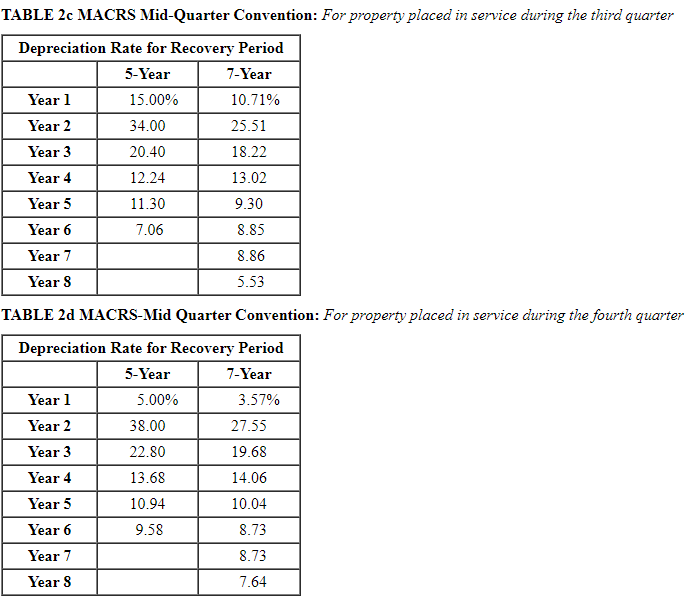
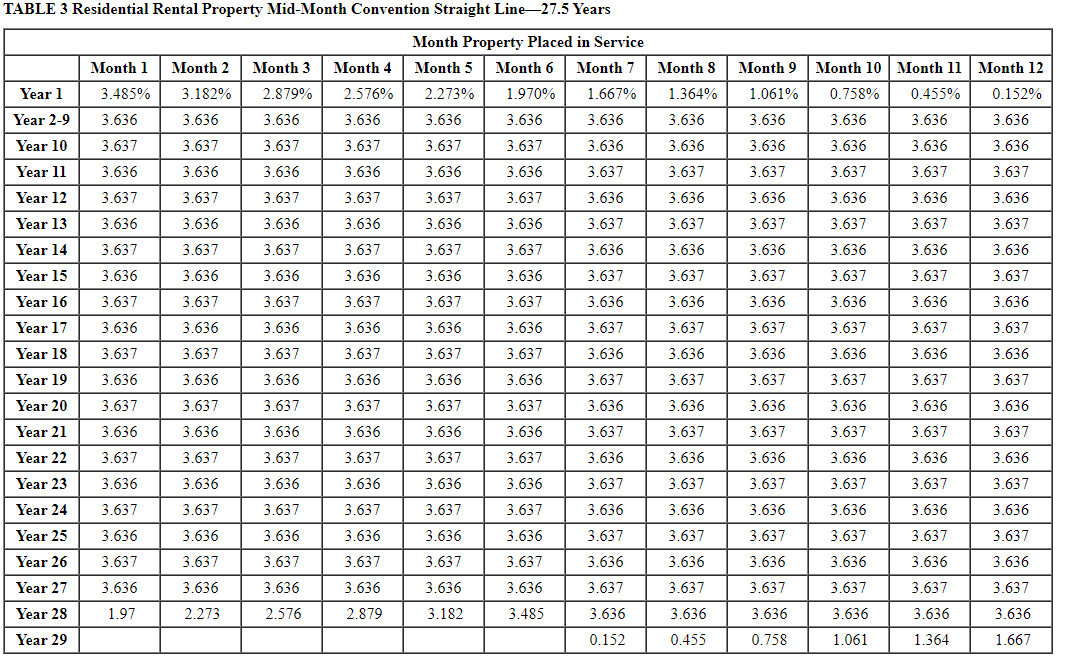
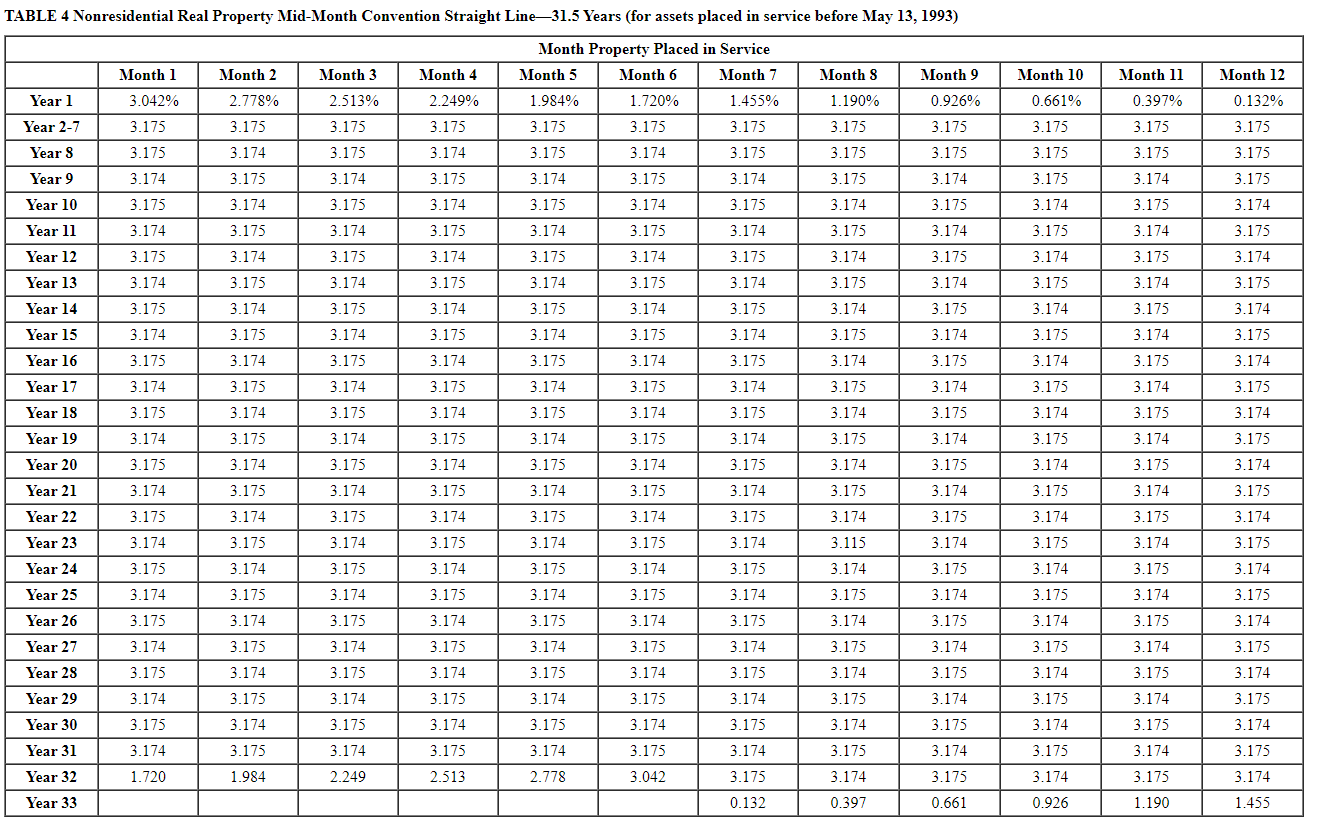
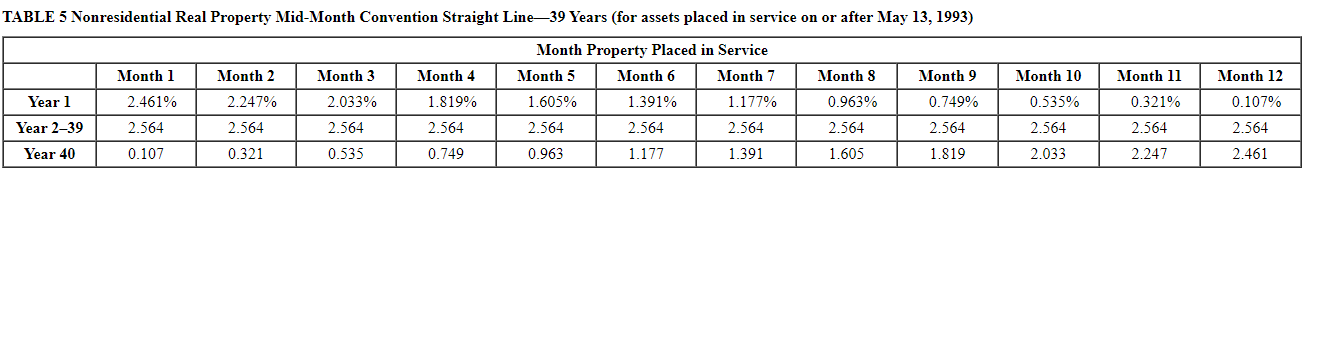
Required information [The following information applies to the questions displayed below.) AMP Corporation (calendar-year-end) has 2019 taxable income of $1,900,000 for purposes of computing the $179 expense. During 2019, AMP acquired the following assets: (Use MACRS Table 1, Table 2. Table 3, Table 4 and Table 5.) Asset Machinery Computer equipment Office building Total Placed in Service September 12 February 10 April 2 Basis $ 1,540,000 490,000 605,000 $ 2,635,000 a. What is the maximum amount of $179 expense AMP may deduct for 2019? Maximum $179 expense deductible b. What is the maximum total depreciation, including $179 expense, that AMP may deduct in 2019 on the assets it placed in service in 2019, assuming no bonus depreciation? (Round your intermediate calculations to the nearest whole dollar amount.) Maximum total depreciation (including $179 expense) TABLE 2a MACRS Mid-Quarter Convention: For property placed in service during the first quarter Depreciation Rate for Recovery Period 5-Year 7-Year Year 1 35.00% 25.00% Year 2 26.00 21.43 Year 3 15.60 15.31 Year 4 | 11.01 10.93 Year 5 11.01 8.75 Year 6 1.38 8.74 Year 7 8.75 Year 8 1.09 TABLE 26 MACRS Mid-Quarter Convention: For property placed in service during the second quarter Depreciation Rate for Recovery Period 5-Year 7-Year Year 1 I 25.00% ] 17.85% Year 2 30.00 23.47 Year 3 18.00 16.76 Year 4 11.37 11.97 Year 5 11.37 | 8.87 Year 6 4.26 8.87 Year 7 8.87 Year 3 3.34 TABLE 2c MACRS Mid-Quarter Convention: For property placed in service during the third quarter | Depreciation Rate for Recovery Period 5-Year 7-Year Yearl 15.00% 10.71% Year 2 34.00 25.51 Year 3 20.40 18.22 Year 4 12.24 13.02 Year 5 11.30 9.30 Year 6 7.06 8.85 1 Year 7 8.86 Year 8 5.53 TABLE 20 MACRS-Mid Quarter Convention: For property placed in service during the fourth quarter | Depreciation Rate for Recovery Period 5-Year 7-Year 1 Yearl 5.00% 3.57% Year 2 38.00 27.55 Year 3 22.80 19.68 Year 4 13.68 14.06 Year 5 10.94 10.04 Year 6 9.58 8.73 Year 7 8.73 Years 7.64 TABLE 3 Residential Rental Property Mid-Month Convention Straight Line27.5 Years Month Property Placed in Service Month 1 Month 2 Month 3 Month 4 Month 5 Month 6 Month 7 | Month 3 Month 9 Month 10 Month 11 Month 12 Year 1 3.485% 3.182% 2.879% 2.576% 2.273% 1.970% 1.667% 1.364% 1.061% 0.758% 0.455% 0.152% Year 2-9 3.636 3.636 3.636 | 3.636 | 3.636 3 .636 3.636 | 3.636 3.636 3.636 3.636 3.636 Year 10 3.637 3.637 3.6373 .637 3.637 3.6373 .6363 .6363 .636 3.636 3.636 3.636 Year 11 3.6363.6363.6363.6363.6363.6363.637 3.637 3.637 3.637 3.637 3.637 Year 12 3.637 3.637 3.637 | 3.637 3.637 3.637 3.636 3.636 3.636 3.636 3.636 | 3.636 Year 13 3.636 | 3.636 | 3.636 3.636 3.636 3.636 3.637 3.637 3.637 | 3.637 3.637 3.637 Year 14 3.637 3.637 3.637 3.637 3.637 3.637 3.636 | 3.636 | 3.636 3.636 3.636 3.636 Year 15 3.636 | 3.636 3.636 3.636 3.636 3.636 3.637 3.637 3.637 3.637 3.637 3.637 Year 16 3.637 3.637 3.637 3.637 3.637 3.637 3.636 3.636 3.636 3.636 3.636 3.636 Year 17 3.636 3.6363.636 3.636 3.636 3.636 3.6373.6373.6373.6373.637 3.637 Year 18 3.637 3.637 3.637 3.637 3.637 3.637 3.636 | 3.636 | 3.636 3.636 3.636 3.636 Year 19 3.636 3.6363 .6363 .636 3.636 3.636 3.637 3.637 3 .637 3.637 3.637 3.637 Year 20 3.637 3.637 3.637 | 3.637 3.637 3.637 3.636 3.636 3.636 3.636 3.636 | 3.636 Year 21 3.6363.6363.6363.6363.6363.6363.6373.637 3.6373.6373.637 3.637 Year 22 3.637 3.637 3.637 3.637 3.637 3.637 3.636 | 3.636 | 3.636 3.636 3.636 3.636 Year 23 3.636 | 3.636 | 3.636 3.636 3 .636 3.636 3.637 3.637 3.637 | 3.637 3.637 3.637 Year 24 3.637 | 3.637 3.637 3.637 3.637 3.637 3.636 3.636 3.636 | 3.636 | 3.636 3.636 Year 25 3.636 3.636 3.636 | 3.636 3.636 3.636 3.637 3.637 3.637 3.637 3.637 | 3.637 Year 26 3.637 3.637 3.6373.637 3.637 3.637 3.6363.6363.6363.6363.6363.636 | Year 27 3.6363.6363.6363.6363.6363.6363.6373.6373.6373.6373.6373.637 Year 28 1.97 2.273 2.576 2.879 3.182 3.485 3.636 3.636 3.636 3.636 3.636 3.636 Year 29 0.152 0.455 0.758 1.061 1.364 1.667