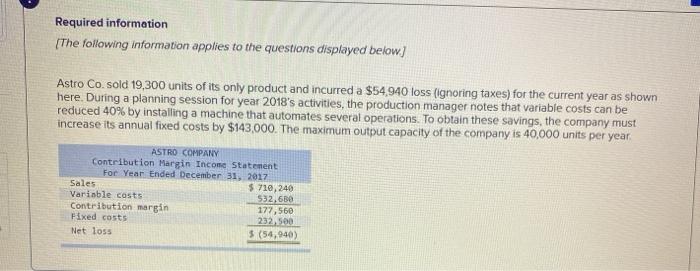
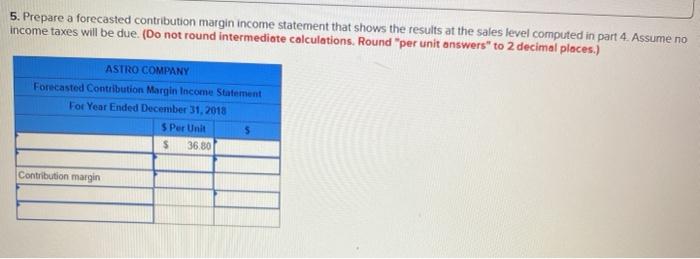
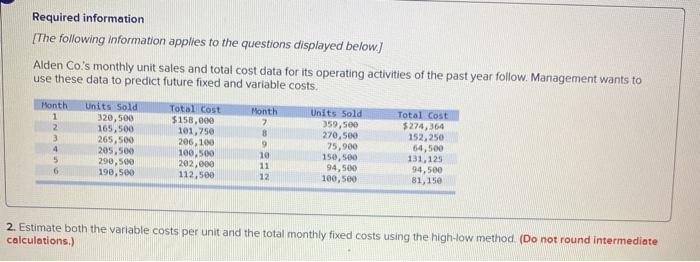
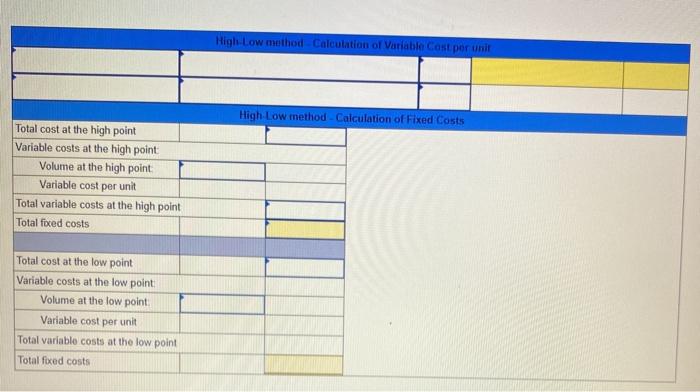
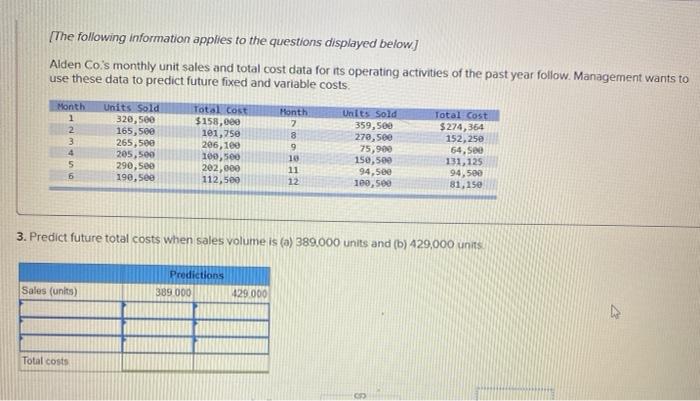
Required information [The following information applies to the questions displayed below) Astro Co. sold 19,300 units of its only product and incurred a $54.940 loss (ignoring taxes) for the current year as shown here. During a planning session for year 2018's activities, the production manager notes that variable costs can be reduced 40% by installing a machine that automates several operations. To obtain these savings, the company must increase its annual fixed costs by $143,000. The maximum output capacity of the company is 40,000 units per year. ASTRO COMPANY Contribution Margin Income Statement For Year Ended December 31, 2017 $ 719,240 Contribution margin Fixed costs 5 (54,940) Sales Variable costs $32.680 177,560 232,500 Net loss 5. Prepare a forecasted contribution margin income statement that shows the results at the sales level computed in part 4. Assume no income taxes will be due. (Do not round intermediate calculations. Round "per unit answers" to 2 decimal places.) ASTRO COMPANY Forecasted Contribution Margin Income Statement For Year Ended December 31, 2018 $ Per Unit 36.80 Contribution margin Required information [The following information applies to the questions displayed below.) Alden Co.'s monthly unit sales and total cost data for its operating activities of the past year follow. Management wants to use these data to predict future fixed and variable costs. Month 1 2 Units Sold 320,500 165,500 265,500 205,500 290,500 190,500 Total Cost $158,000 101,750 206,100 100,500 202.000 112,500 Month 7 8 9 10 11 12 Units Sold 359, see 270,500 75,900 150,500 94,500 100,500 Total Cost $274,364 152,250 64,500 131,125 94,500 81,150 2. Estimate both the variable calculations.) Osts per unit and the total monthly fixed costs using the high-low method (Do not round intermediate High-Low method Calculation of Variable Cost per unit High-Low method - Calculation of Fixed Costs Total cost at the high point Variable costs at the high point Volume at the high point Variable cost per unit Total variable costs at the high point Total fixed costs Total cost at the low point Variable costs at the low point Volume at the low point Variable cost per unit Total variable costs at the low point Total fixed costs [The following information applies to the questions displayed below] Alden Co.'s monthly unit sales and total cost data for its operating activities of the past year follow. Management wants to use these data to predict future fixed and variable costs Month 1 2 3 4 5 6 Units Sold 320,500 165,500 265,500 205,500 290,500 190, 500 Total cost $158,000 101,750 206,100 100, 500 202,000 112,500 Month 7 8 9 10 11 Units Sold 359,500 278, see 75,900 150,500 94,58e 100, 500 Total Cost $274,364 152, 250 64. Se 131,125 94,500 81,150 3. Predict future total costs when sales volume is (a) 389.000 units and (b) 429,000 units Sales (units) Predictions 389 000 429 000 Total costs
