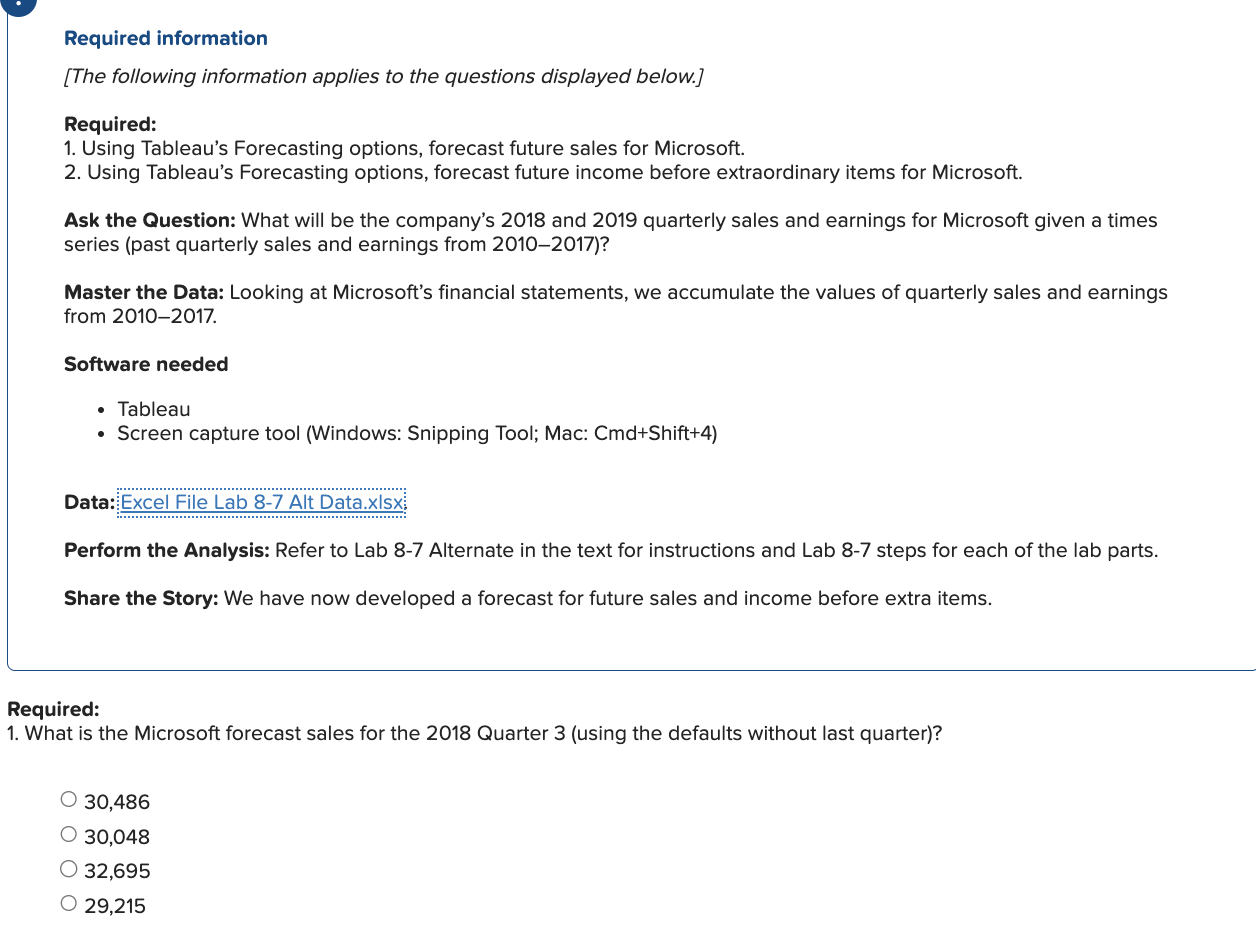
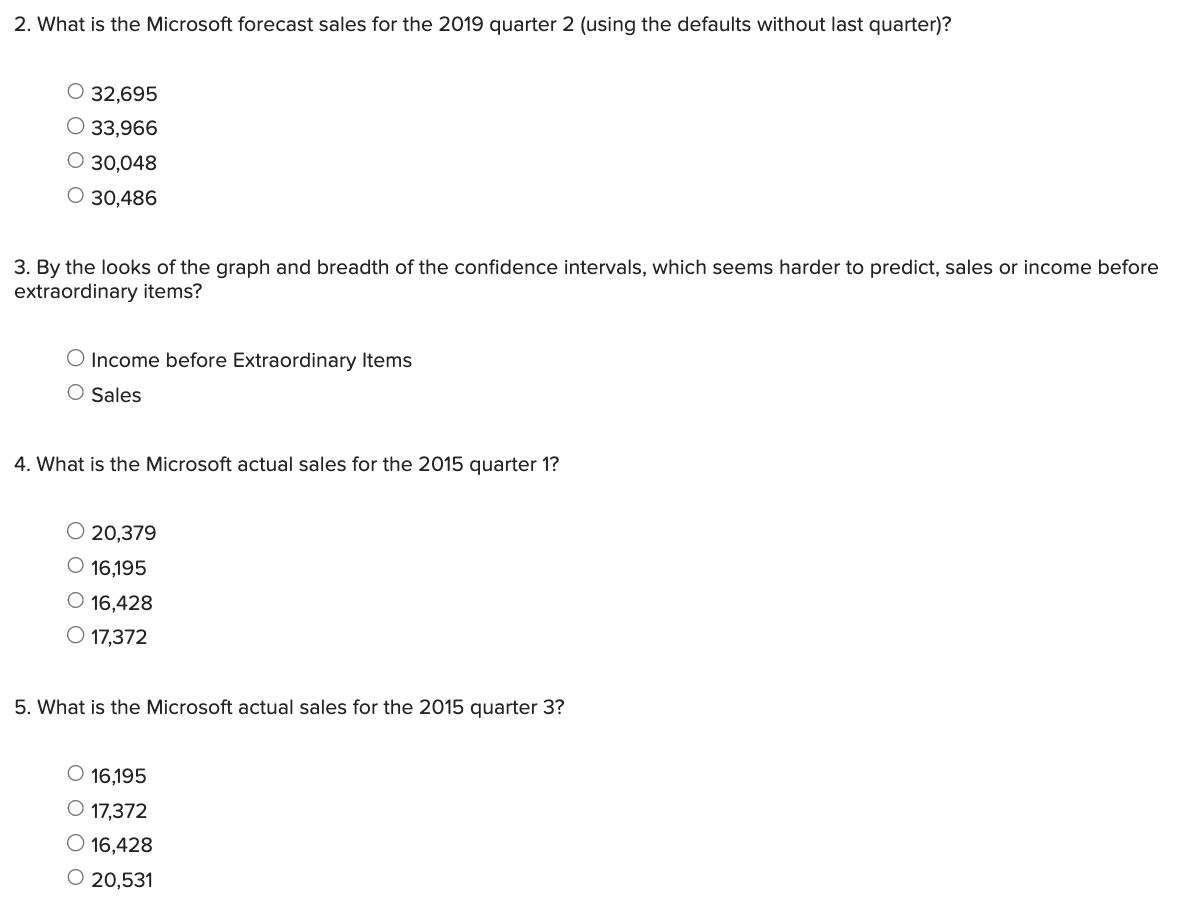
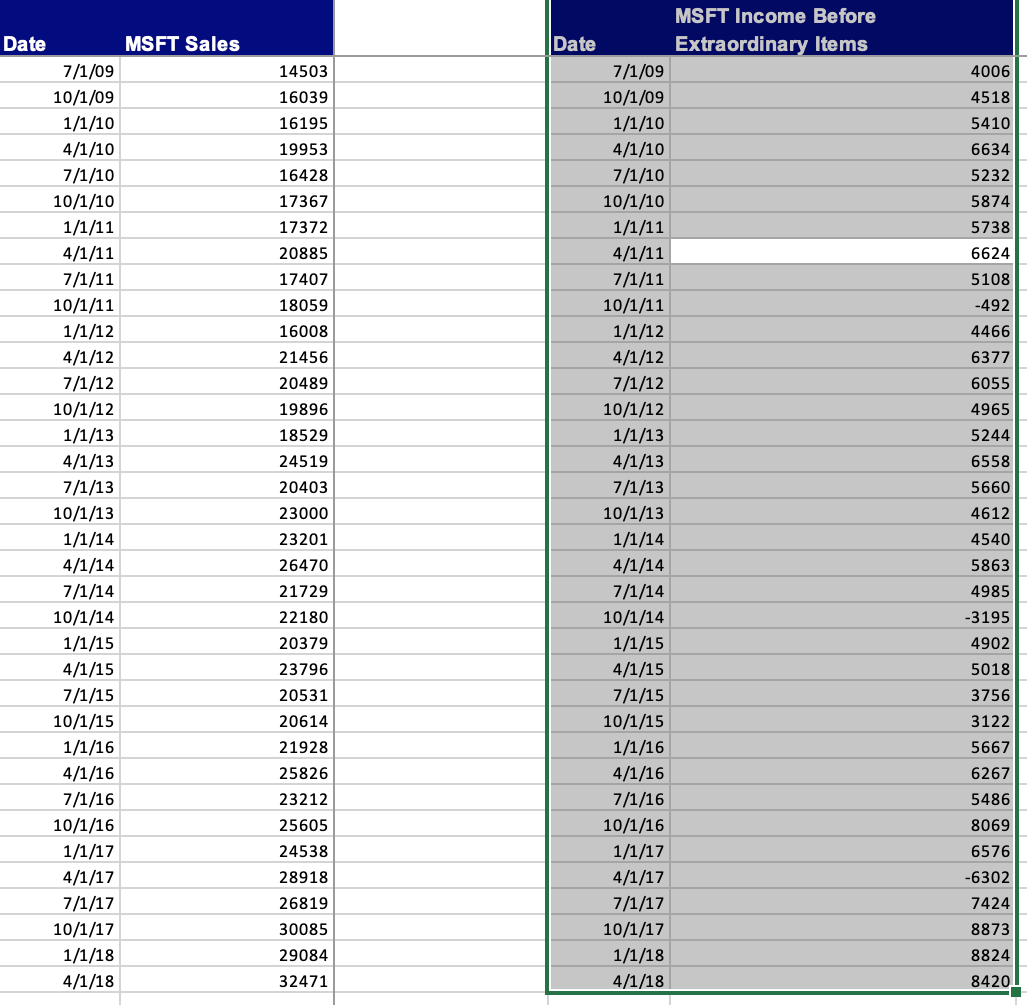
Required information [The following information applies to the questions displayed below.] Required: 1. Using Tableau's Forecasting options, forecast future sales for Microsoft. 2. Using Tableau's Forecasting options, forecast future income before extraordinary items for Microsoft. Ask the Question: What will be the company's 2018 and 2019 quarterly sales and earnings for Microsoft given a times series (past quarterly sales and earnings from 2010-2017)? Master the Data: Looking at Microsoft's financial statements, we accumulate the values of quarterly sales and earnings from 2010-2017. Software needed - Tableau - Screen capture tool (Windows: Snipping Tool; Mac: Cmd+Shift+4) Data: Perform the Analysis: Refer to Lab 8-7 Alternate in the text for instructions and Lab 8-7 steps for each of the lab parts. Share the Story: We have now developed a forecast for future sales and income before extra items. Required: 1. What is the Microsoft forecast sales for the 2018 Quarter 3 (using the defaults without last quarter)? 30,48630,04832,69529,215 2. What is the Microsoft forecast sales for the 2019 quarter 2 (using the defaults without last quarter)? 32,69533,96630,04830,486 3. By the looks of the graph and breadth of the confidence intervals, which seems harder to predict, sales or income before extraordinary items? Income before Extraordinary Items Sales 4. What is the Microsoft actual sales for the 2015 quarter 1 ? 20,37916,19516,42817,372 5. What is the Microsoft actual sales for the 2015 quarter 3? 16,19517,37216,42820,531 Required information [The following information applies to the questions displayed below.] Required: 1. Using Tableau's Forecasting options, forecast future sales for Microsoft. 2. Using Tableau's Forecasting options, forecast future income before extraordinary items for Microsoft. Ask the Question: What will be the company's 2018 and 2019 quarterly sales and earnings for Microsoft given a times series (past quarterly sales and earnings from 2010-2017)? Master the Data: Looking at Microsoft's financial statements, we accumulate the values of quarterly sales and earnings from 2010-2017. Software needed - Tableau - Screen capture tool (Windows: Snipping Tool; Mac: Cmd+Shift+4) Data: Perform the Analysis: Refer to Lab 8-7 Alternate in the text for instructions and Lab 8-7 steps for each of the lab parts. Share the Story: We have now developed a forecast for future sales and income before extra items. Required: 1. What is the Microsoft forecast sales for the 2018 Quarter 3 (using the defaults without last quarter)? 30,48630,04832,69529,215 2. What is the Microsoft forecast sales for the 2019 quarter 2 (using the defaults without last quarter)? 32,69533,96630,04830,486 3. By the looks of the graph and breadth of the confidence intervals, which seems harder to predict, sales or income before extraordinary items? Income before Extraordinary Items Sales 4. What is the Microsoft actual sales for the 2015 quarter 1 ? 20,37916,19516,42817,372 5. What is the Microsoft actual sales for the 2015 quarter 3? 16,19517,37216,42820,531