Answered step by step
Verified Expert Solution
Question
1 Approved Answer
Required: Which of the following charts would be appropriate to geographically visualize the concentration by number of customers. (You may select more than one answer.
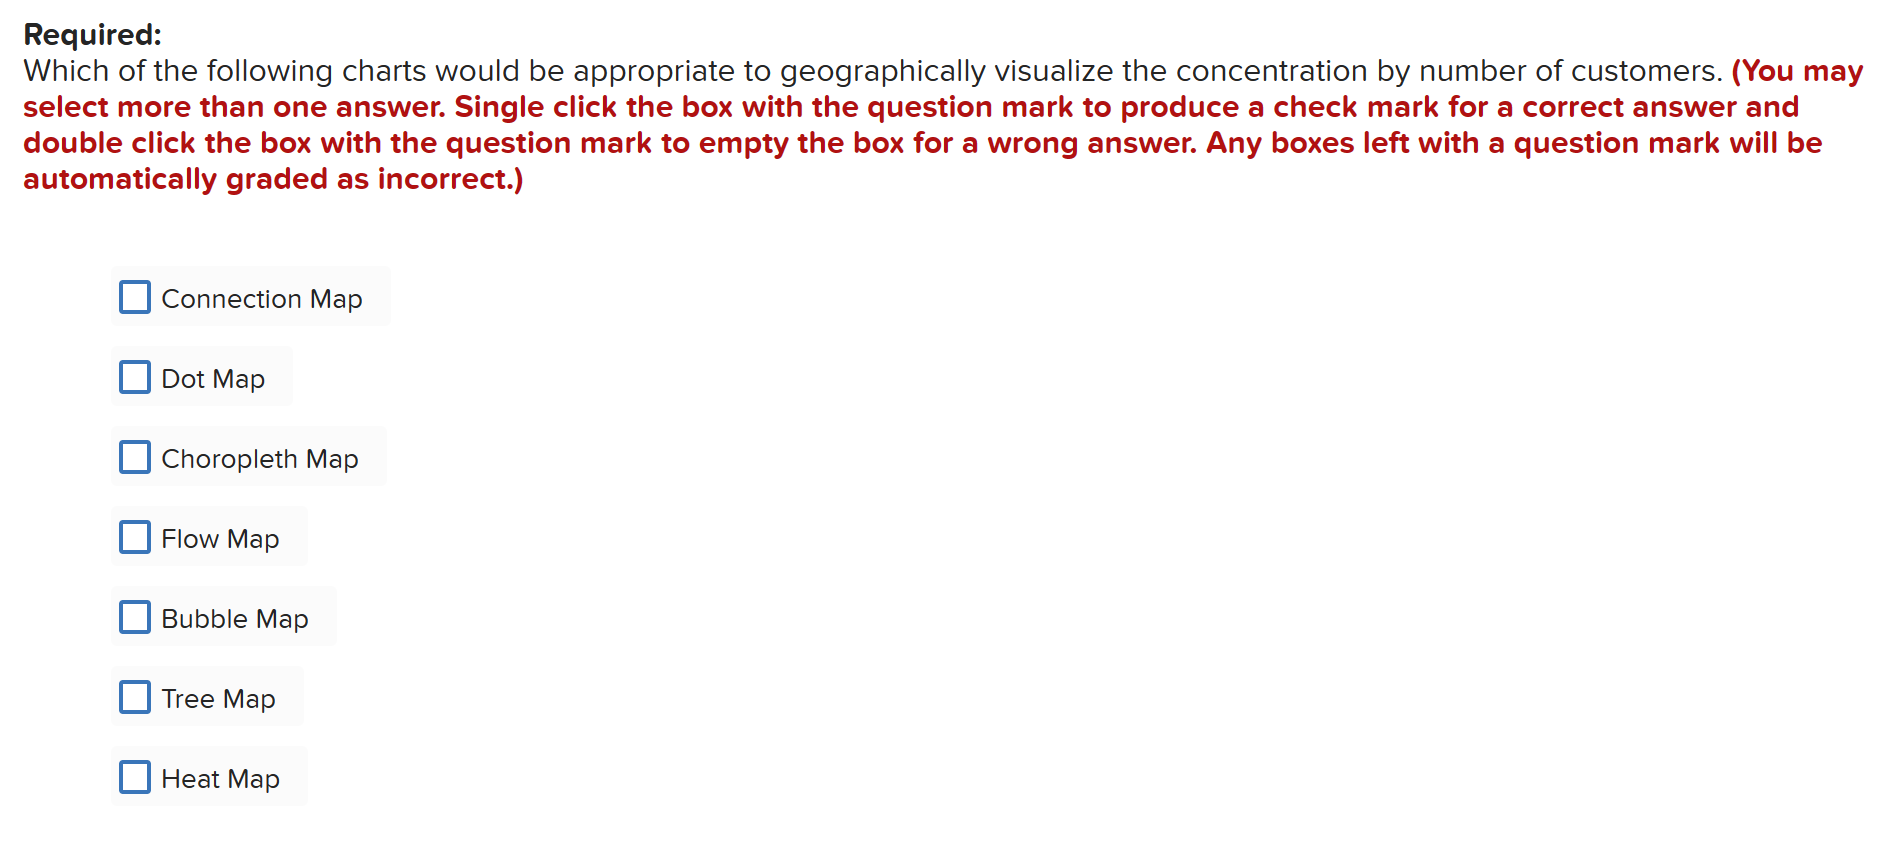
 Required: Which of the following charts would be appropriate to geographically visualize the concentration by number of customers. (You may select more than one answer. Single click the box with the question mark to produce a check mark for a correct answer and double click the box with the question mark to empty the box for a wrong answer. Any boxes left with a question mark will be automatically graded as incorrect.) Connection Map Dot Map Choropleth Map Flow Map Bubble Map Tree Map Heat Map
 Step by Step Solution
There are 3 Steps involved in it
Step: 1

Get Instant Access to Expert-Tailored Solutions
See step-by-step solutions with expert insights and AI powered tools for academic success
Step: 2

Step: 3

Ace Your Homework with AI
Get the answers you need in no time with our AI-driven, step-by-step assistance
Get Started


