

Answered step by step
Verified Expert Solution
Question
1 Approved Answer
Requirements (answer in the same order and indicate each question's number): 1. Indicate the name of the chart pattern depicted below. 2. Explain the consolidation
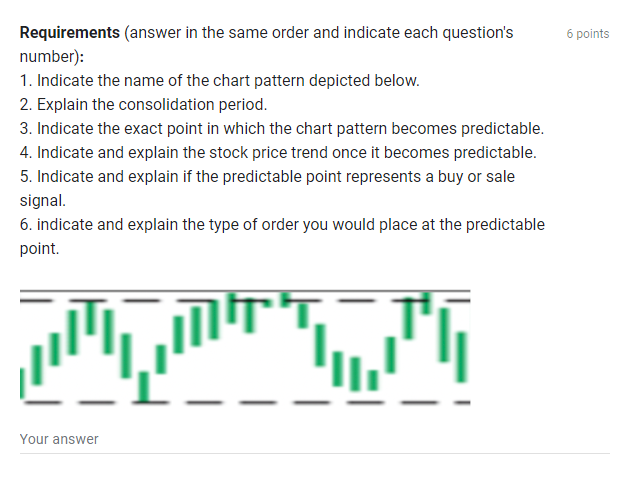 Requirements (answer in the same order and indicate each question's number): 1. Indicate the name of the chart pattern depicted below. 2. Explain the consolidation period. 3. Indicate the exact point in which the chart pattern becomes predictable. 4. Indicate and explain the stock price trend once it becomes predictable. 5. Indicate and explain if the predictable point represents a buy or sale signal. 6. indicate and explain the type of order you would place at the predictable point. Your
Step by Step Solution
There are 3 Steps involved in it
Step: 1

Get Instant Access to Expert-Tailored Solutions
See step-by-step solutions with expert insights and AI powered tools for academic success
Step: 2

Step: 3
Ace Your Homework with AI
Get the answers you need in no time with our AI-driven, step-by-step assistance
Get Started
Behavioral Finance And Investor Types
Authors: Michael M. Pompian
1st Edition
1118011503, 978-1118011508