Answered step by step
Verified Expert Solution
Question
1 Approved Answer
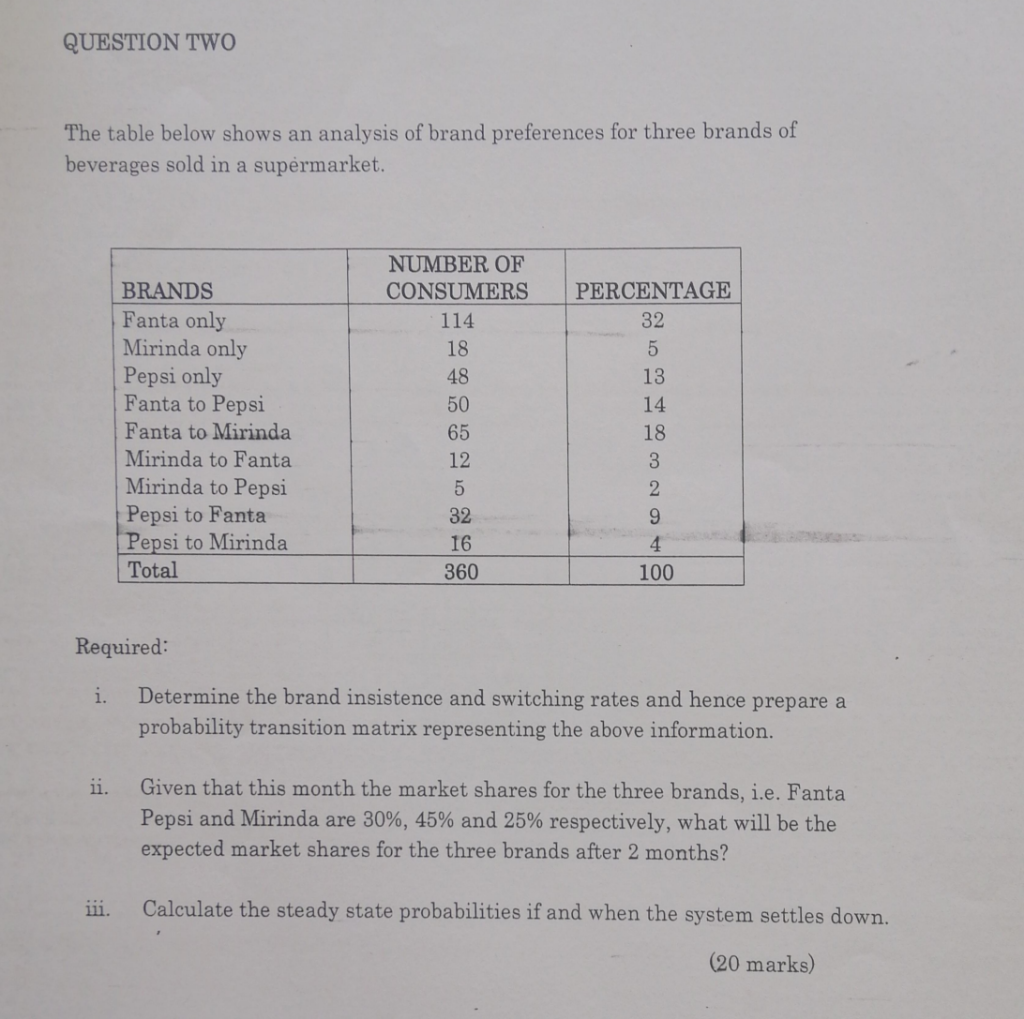
RESEARCH OPERATION QUESTION TWO The table below shows an analysis of brand preferences for three brands of beverages sold in a supermarket. i. ii. BRANDS
RESEARCH OPERATION
QUESTION TWO The table below shows an analysis of brand preferences for three brands of beverages sold in a supermarket. i. ii. BRANDS Fanta only Mirinda only Pepsi only Fanta to Pepsi Fanta to Mirinda Required: iii. Mirinda to Fanta. Mirinda to Pepsi Pepsi to Fanta Pepsi to Mirinda Total NUMBER OF CONSUMERS PERCENTAGE 114 32 18 5 13 14 48 50 65 12 5 32 16 360 8ASNE I 18 9 100 Determine the brand insistence and switching rates and hence prepare a probability transition matrix representing the above information. Given that this month the market shares for the three brands, i.e. Fanta Pepsi and Mirinda are 30%, 45% and 25% respectively, what will be the expected market shares for the three brands after 2 months? Calculate the steady state probabilities if and when the system settles down. (20 marks)Step by Step Solution
There are 3 Steps involved in it
Step: 1
Get Instant Access to Expert-Tailored Solutions
See step-by-step solutions with expert insights and AI powered tools for academic success
Step: 2
Step: 3
Ace Your Homework with AI
Get the answers you need in no time with our AI-driven, step-by-step assistance
Get Started