Answered step by step
Verified Expert Solution
Question
1 Approved Answer
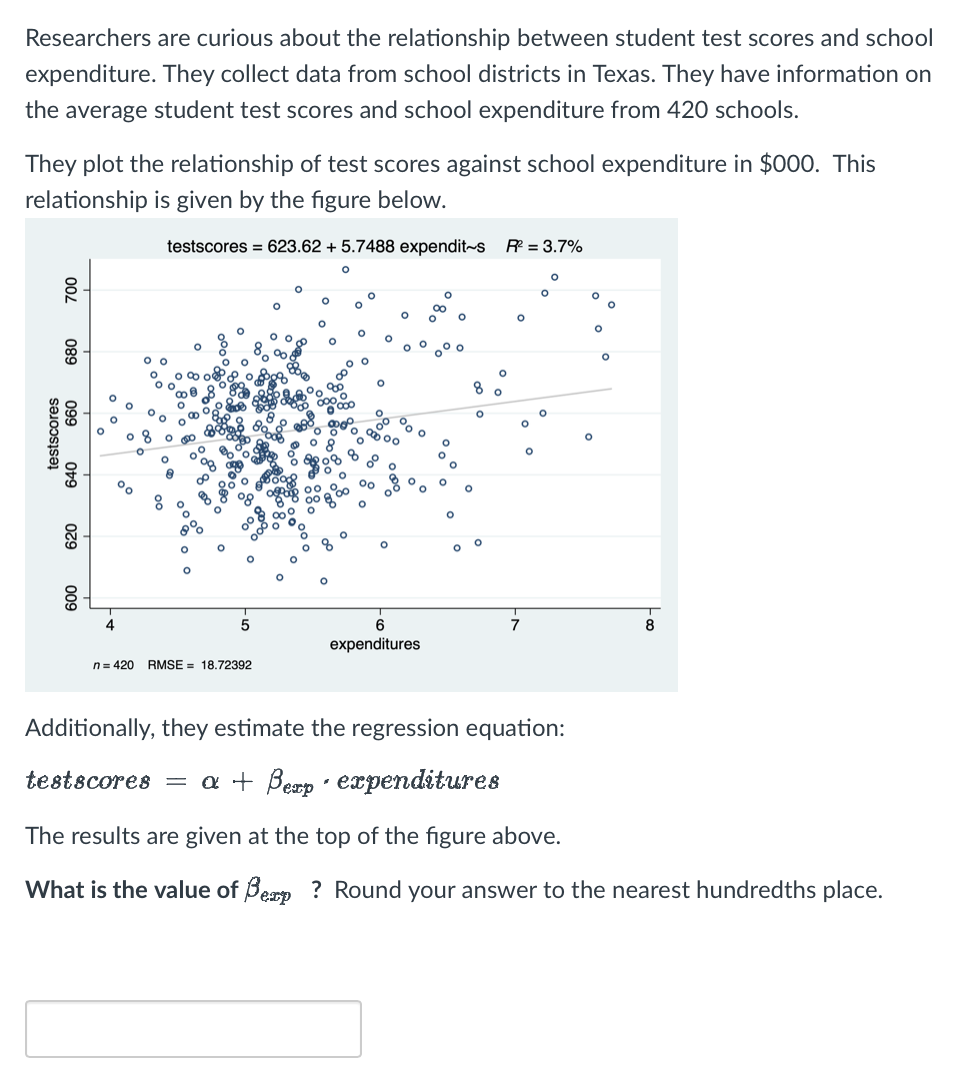
Researchers are curious about the relationship between student test scores and school expenditure. They collect data from school districts in Texas. They have information


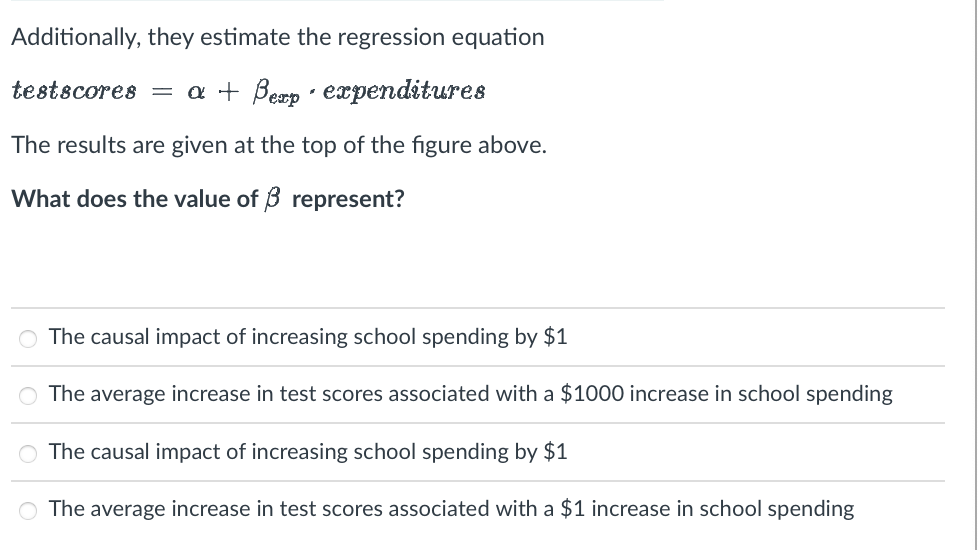
Researchers are curious about the relationship between student test scores and school expenditure. They collect data from school districts in Texas. They have information on the average student test scores and school expenditure from 420 schools. They plot the relationship of test scores against school expenditure in $000. This relationship is given by the figure below. 700 680 660 testscores 640 620 4 testscores = 623.62 +5.7488 expendit~s R = 3.7% O 5 n = 420 RMSE = 18.72392 O 8000 O O 9 O C O 20 O O O 6 expenditures 00 O O O O O O 8 0 O O O O 7 O O O O O O O 8 Additionally, they estimate the regression equation: testscores = a + Bezp expenditures The results are given at the top of the figure above. What is the value of Berp? Round your answer to the nearest hundredths place. Additionally, they estimate the regression equation testscores = a + Berp expenditures The results are given at the top of the figure above. What does the value of 3 represent? . O The causal impact of increasing school spending by $1 O The average increase in test scores associated with a $1000 increase in school spending O The causal impact of increasing school spending by $1 O The average increase in test scores associated with a $1 increase in school spending
Step by Step Solution
There are 3 Steps involved in it
Step: 1

Get Instant Access to Expert-Tailored Solutions
See step-by-step solutions with expert insights and AI powered tools for academic success
Step: 2

Step: 3

Ace Your Homework with AI
Get the answers you need in no time with our AI-driven, step-by-step assistance
Get Started


