

Question
Respond to the following questions related to Starbuck. Show comparative horizontal analysis for Starbuck company for the year 2006 and 2005. a) current ratio b)
Respond to the following questions related to Starbuck. Show comparative horizontal analysis for Starbuck company for the year 2006 and 2005.
a) current ratio
b) quick ratio
c) debt-equity ratio
d) gross profit ratio
e) net profit ratio
f) return of investment
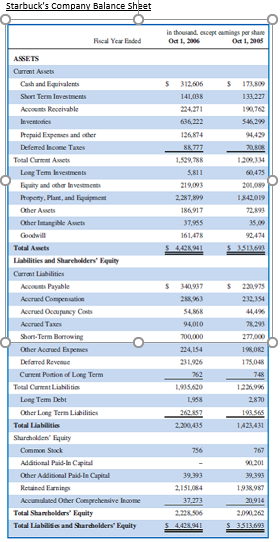
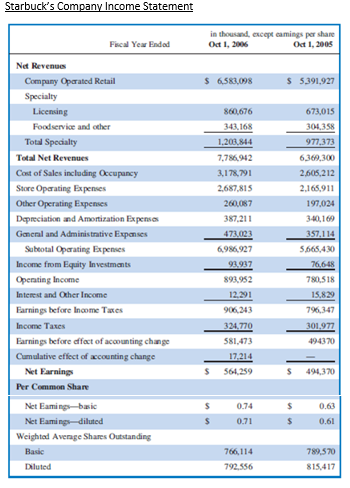
Starbuck's Company Balance sheet in thousand, except cumings per share Od 1. Oct 1, 2005 $ $ 312.606 141,038 131.227 190,760 546,292 Fiscal Year Faded ASSETS Current Assets Cash and lights Short Term Investments Account Rechable Inventos Prepaid Expenses and other Deferred Income Taxes Total Current Asists Long Term levestments Equity and other lovestments Property. Plant, and gent Other Arts Other Intangible Awes 9442 20 636.222 126,674 86,777 1.529.788 5.811 219,093 2.287,899 1865,917 37,955 161.478 S442 941 200.000 1.842,019 72.893 35.00 92.474 $_35 s $ 220,975 232,354 340.937 2,463 54. 94,010 7.293 277,000 5 190K Total Assets Lilities and Shareholders' Equity Currant Liabilities Accounts Payable Accrued Companion Accrued Occupancy Cores Accrued Taxes Short-Term Borrowing Other Accrued Expenses Defarred Revenue Current Puction of Long Term Total Current Liabilities Long Term Debt Other Long Term Liabilities Total Liabilities Sharchaden' Iquity Common Suck Adational Paid In Capital Other Additional Paid-la Capital Retained Barning Accumulated Other Comprehensive Income Total Shareholders' Equity Total Liabilities and Shareholders' Equity 700,000 234,154 231.926 762 1.935.600 1.958 175.048 748 1.22996 2.870 262157 1982565 2,200,435 1423431 756 767 201 39.393 39,393 2,151,054 37.273 2.228.506 5 4.428.941 1938.987 20914 2.090.262 $ 3513.693 Starbuck's Company Income Statement Fiscal Year Ended in thousand, except camins per share Oct 1, 2006 Oct 1, 2005 $ 6.583.098 $ 5.391.927 673,015 304.358 977,373 6.369,300 Net Revenue Company Operated Retail Specialty Licensing Foodservice and other Total Specialty Total Net Revenues Cost of Sales including Occupancy Store Operating Expenses Other Operating Expenses Depreciation and Amortization Expenses General and Administrative Expanses Subtotal Operating Expenses Income from Equity Investments Operating Income Interest and Other Income Earnings before Income Taxes Income Taxes Earnings before dffect of accounting change Cumulative effect of accounting change Net Earnings Per Common Share Net Eamings-basic Net Eaming-diluted Weighted Average Shares Outstanding Basic Diluted 860.676 343.168 1.203.844 7.786,942 3.178,791 2.687,815 260,087 387.211 473.023 6986.927 93.937 893.952 12.291 906343 324.770 581,473 17.214 564.259 2.605,212 2.165.911 197,024 3:40, 169 357,114 5.565,430 76.648 780.518 15.829 796,347 301.977 494370 $ $ 494,370 $ $ 0.74 0.71 $ $ 0.63 0.61 766,114 792.556 789,570 815,417Step by Step Solution
There are 3 Steps involved in it
Step: 1

Get Instant Access to Expert-Tailored Solutions
See step-by-step solutions with expert insights and AI powered tools for academic success
Step: 2

Step: 3
Ace Your Homework with AI
Get the answers you need in no time with our AI-driven, step-by-step assistance
Get Started
The Social Profit Handbook
Authors: David Grant
1st Edition
1603586040, 978-1603586047