 &
&
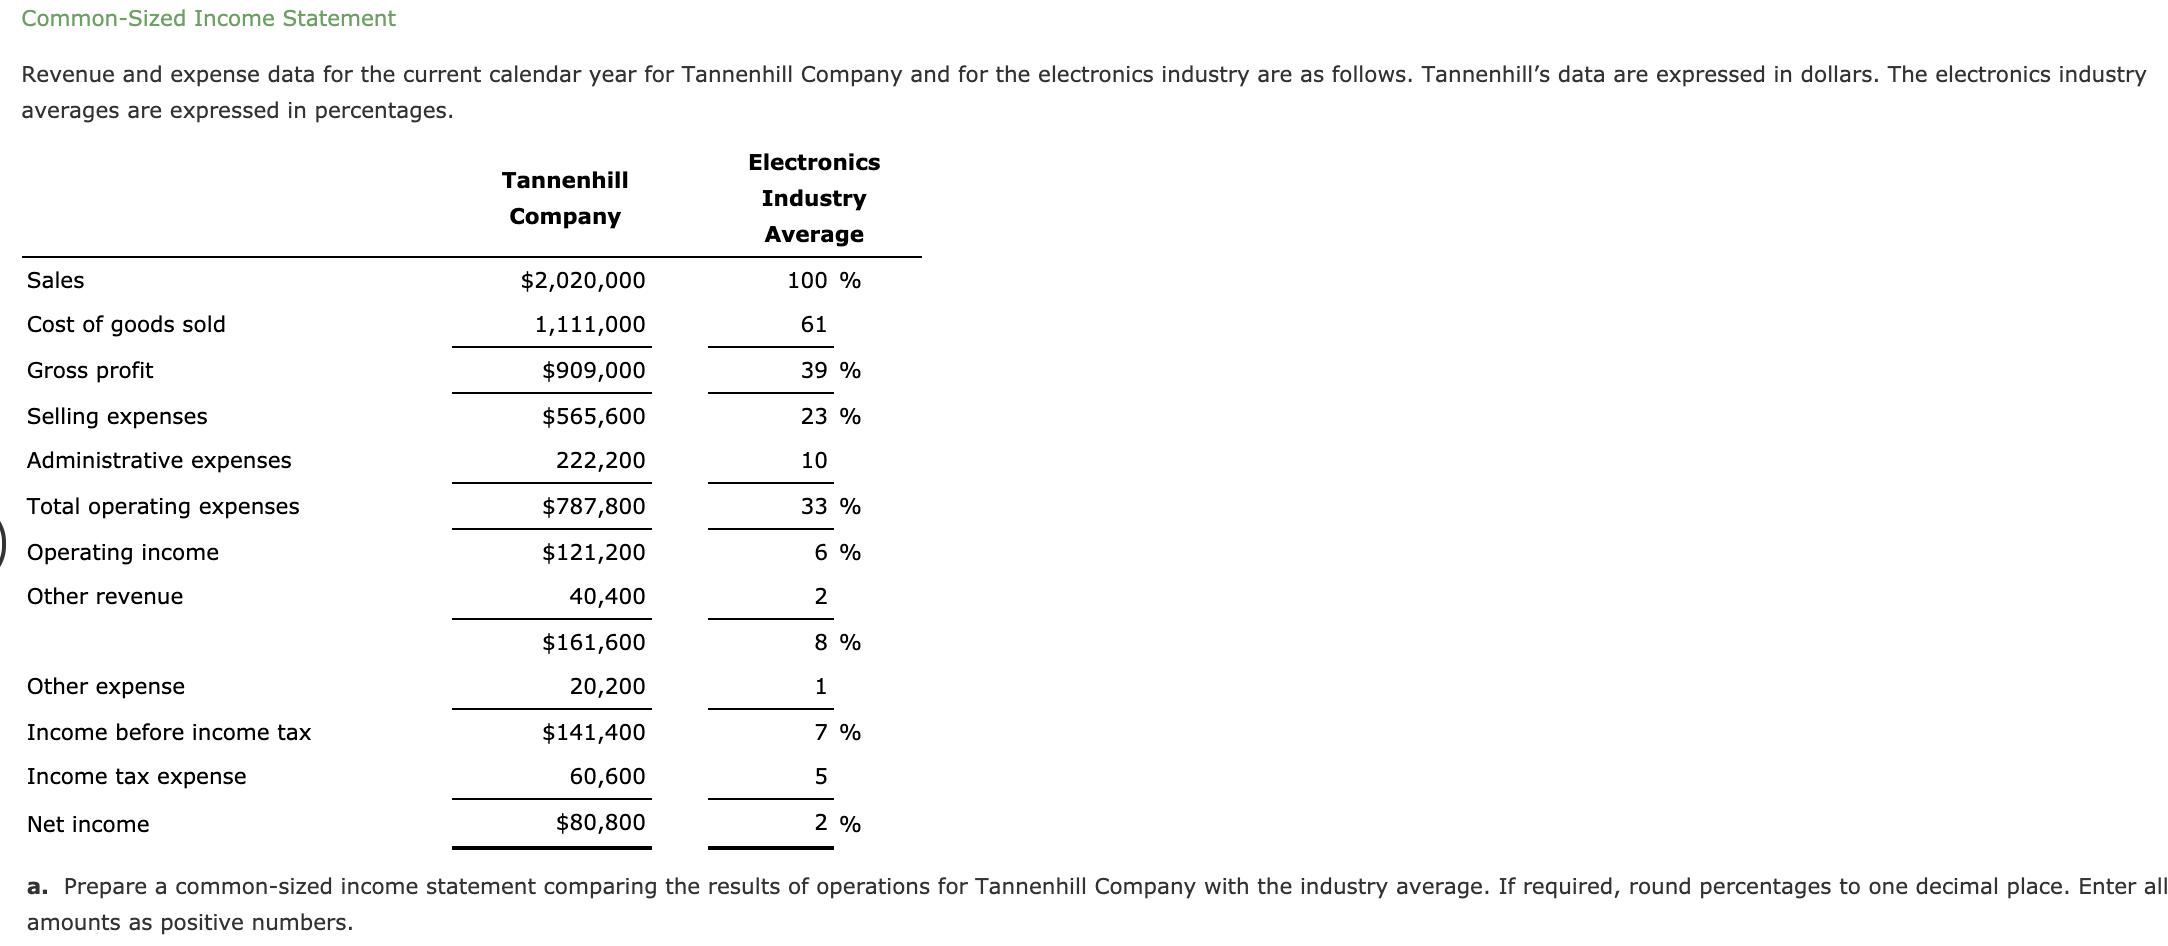
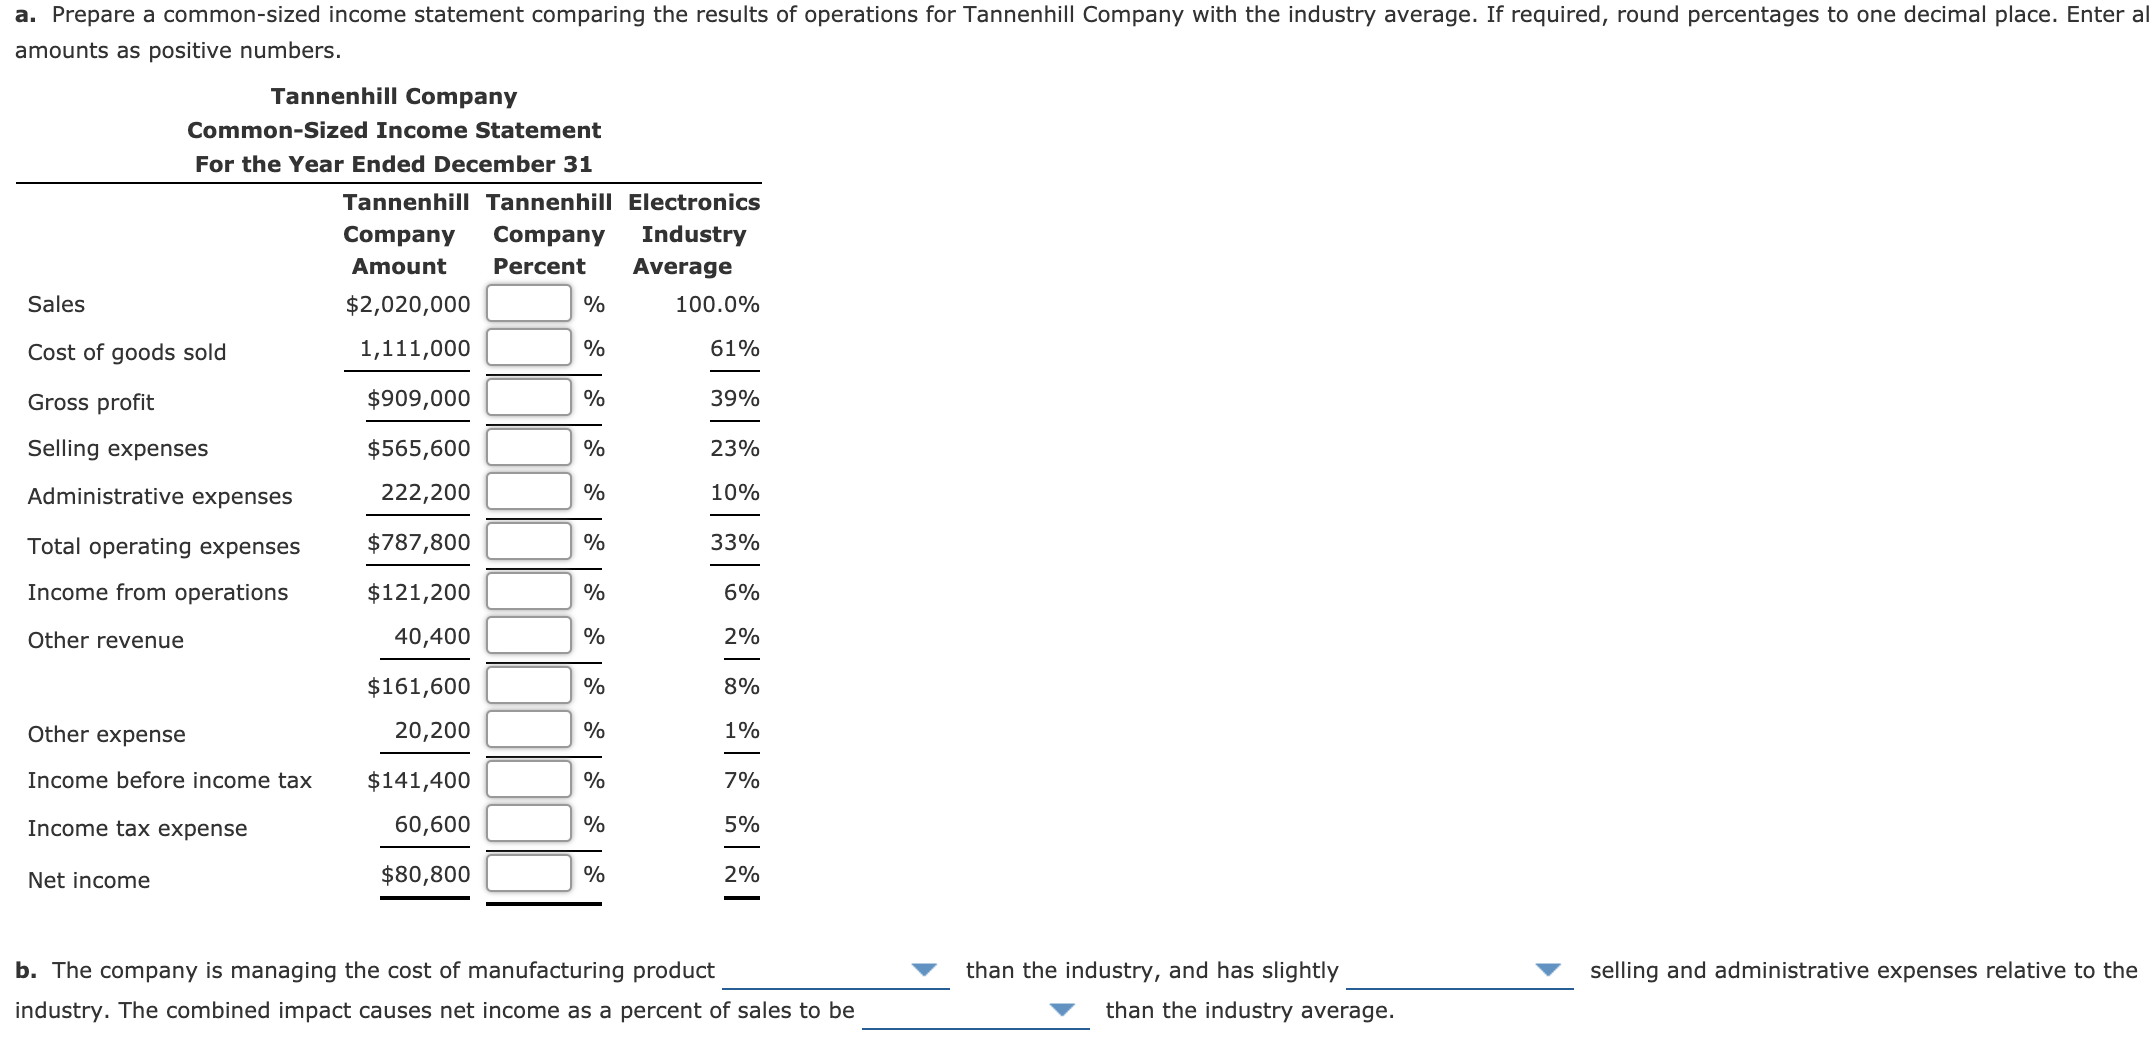
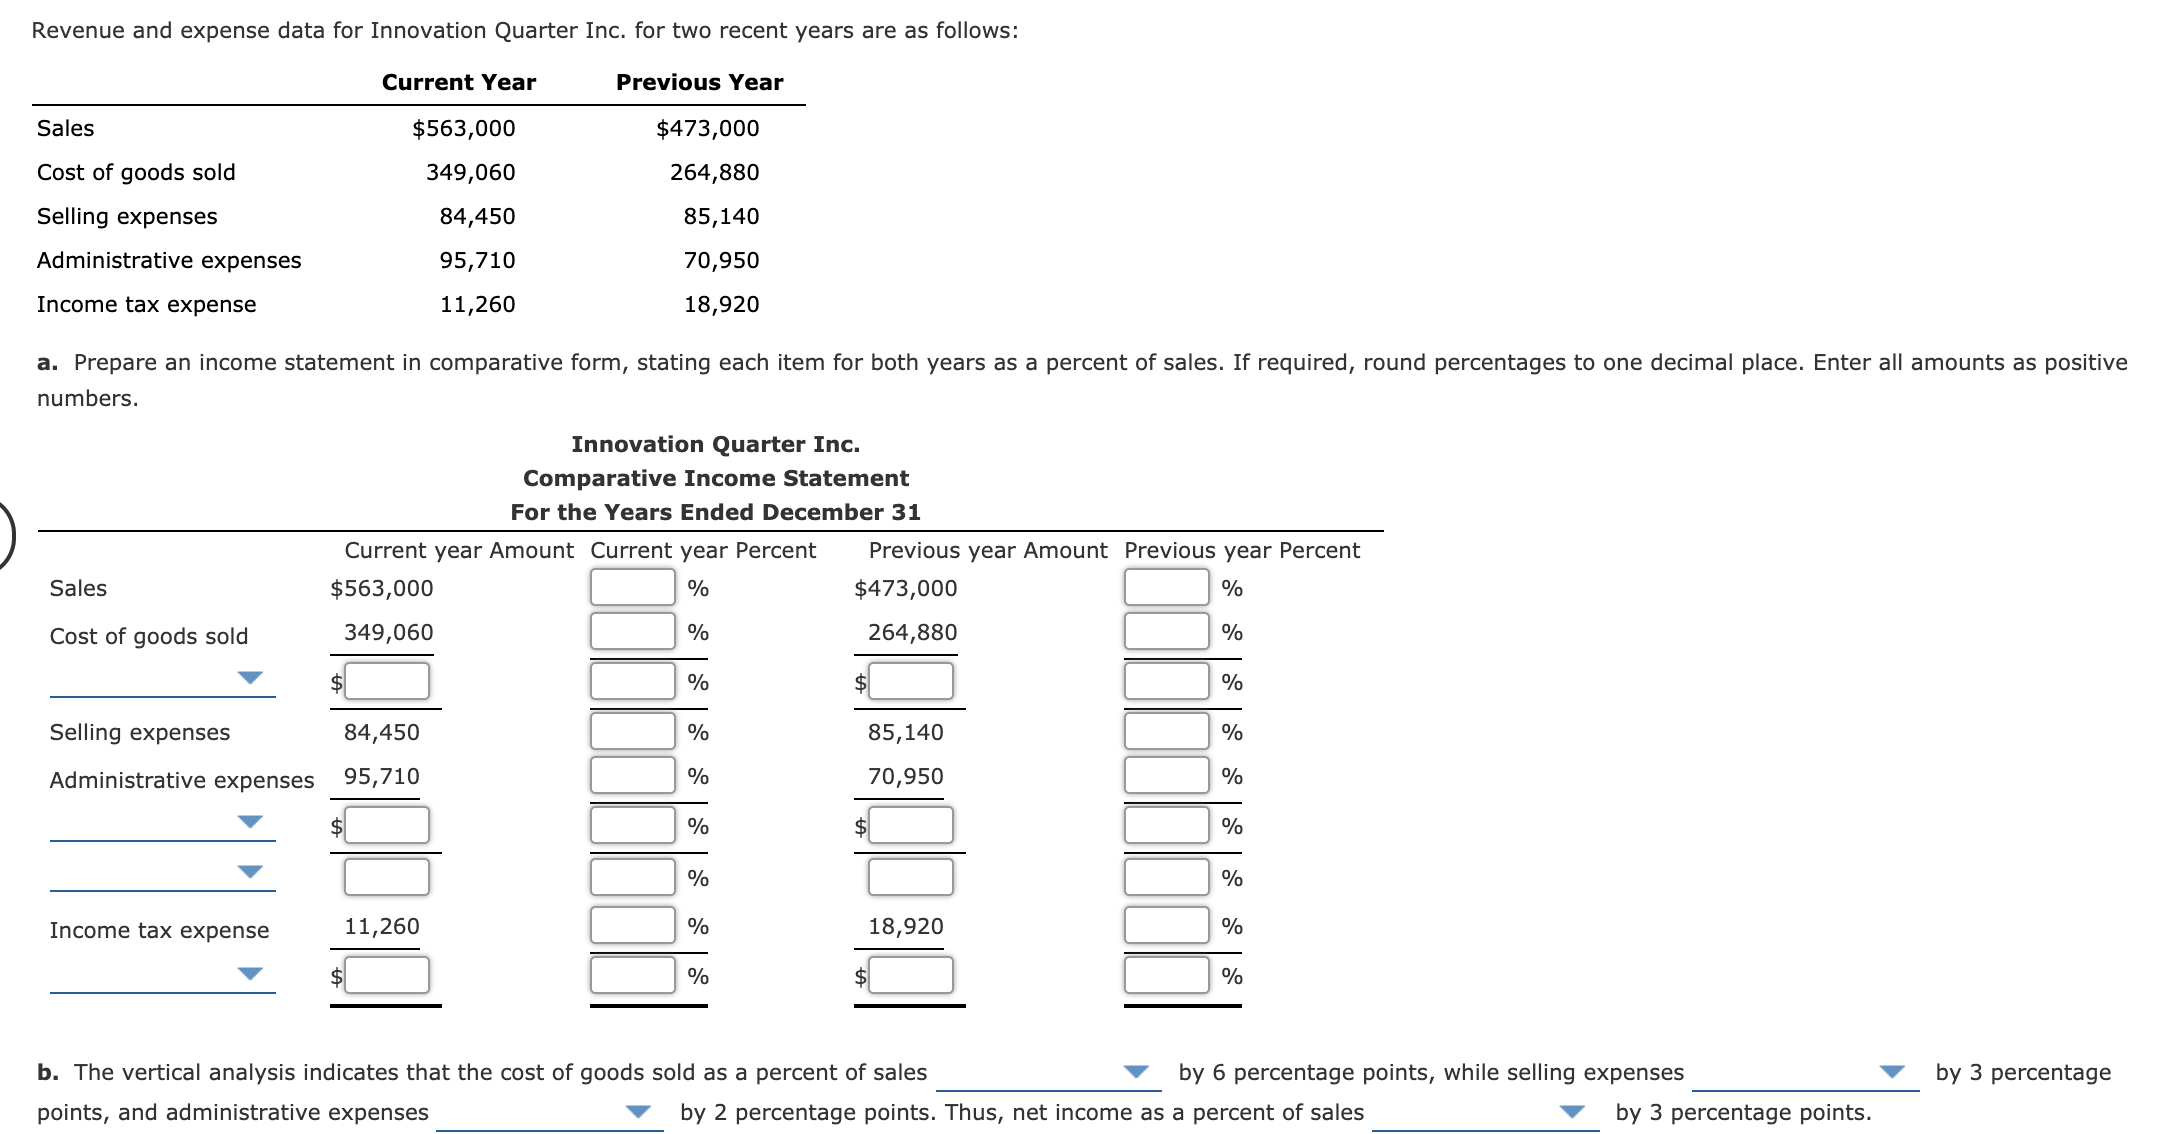
Revenue and expense data for Innovation Quarter Inc. for two recent years are as follows: Current Year Previous Year Sales $563,000 $473,000 264,880 Cost of goods sold 349,060 85,140 Selling expenses Administrative expenses 84,450 95,710 70,950 Income tax expense 11,260 18,920 a. Prepare an income statement in comparative form, stating each item for both years as a percent of sales. If required, round percentages to one decimal place. Enter all amounts as positive numbers. Innovation Quarter Inc. Comparative Income Statement For the Years Ended December 31 Current year Amount Current year Percent Previous year Amount Previous year Percent $563,000 % $473,000 % 349,060 % 264,880 % Sales Cost of goods sold % $ % Selling expenses 84,450 % 85,140 % Administrative expenses 95,710 % 70,950 % % % % % Income tax expense 11,260 % 18,920 % % % by 3 percentage b. The vertical analysis indicates that the cost of goods sold as a percent of sales by 6 percentage points, while selling expenses points, and administrative expenses by 2 percentage points. Thus, net income as a percent of sales by 3 percentage points. Common-Sized Income Statement Revenue and expense data for the current calendar year for Tannenhill Company and for the electronics industry are as follows. Tannenhill's data are expressed in dollars. The electronics industry averages are expressed in percentages. Electronics Tannenhill Company Industry Average Sales 100 % $2,020,000 1,111,000 Cost of goods sold 61 Gross profit $909,000 39 % Selling expenses 23 % $565,600 222,200 Administrative expenses 10 Total operating expenses 33 % $787,800 $121,200 Operating income 6 % Other revenue 40,400 2 $161,600 8 % Other expense 20,200 1 Income before income tax 7 % $141,400 60,600 Income tax expense 5 Net income $80,800 2 % a. Prepare a common-sized income statement comparing the results of operations for Tannenhill Company with the industry average. If required, round percentages to one decimal place. Enter all amounts as positive numbers. a. Prepare a common-sized income statement comparing the results of operations for Tannenhill Company with the industry average. If required, round percentages to one decimal place. Enter al amounts as positive numbers. Tannenhill Company Common-Sized Income Statement For the Year Ended December 31 Tannenhill Tannenhill Electronics Company Company Industry Amount Percent Average Sales $2,020,000 % 100.0% Cost of goods sold 1,111,000 % 61% Gross profit $909,000 % 39% Selling expenses % 23% $565,600 222,200 Administrative expenses % 10% Total operating expenses $787,800 % 33% Income from operations $121,200 % 6% Other revenue 40,400 % 2% $161,600 % 8% Other expense 20,200 % 1% Income before income tax $141,400 % 7% Income tax expense 60,600 % 5% Net income $80,800 % 2% selling and administrative expenses relative to the b. The company is managing the cost of manufacturing product industry. The combined impact causes net income as a percent of sales to be than the industry, and has slightly than the industry average