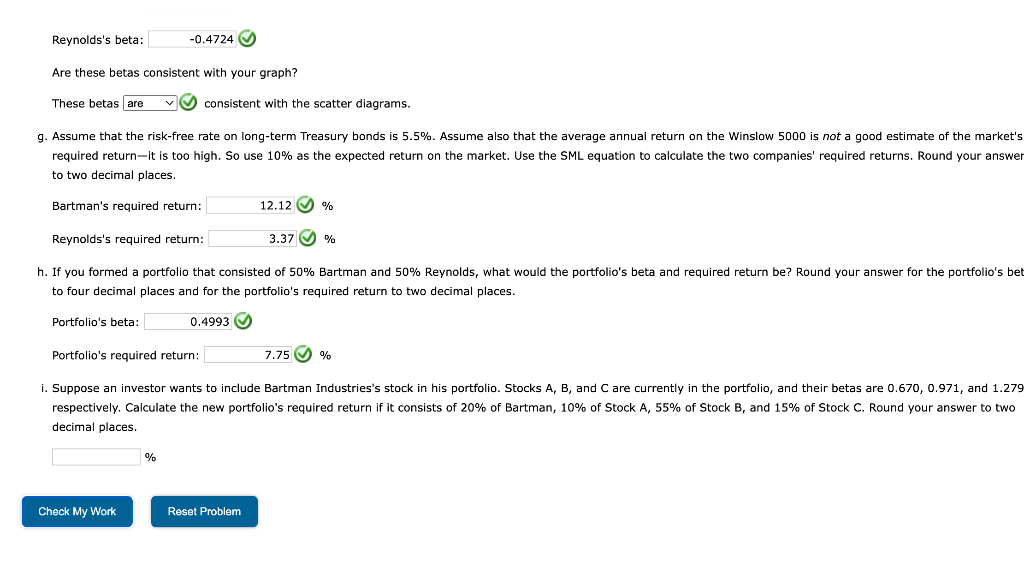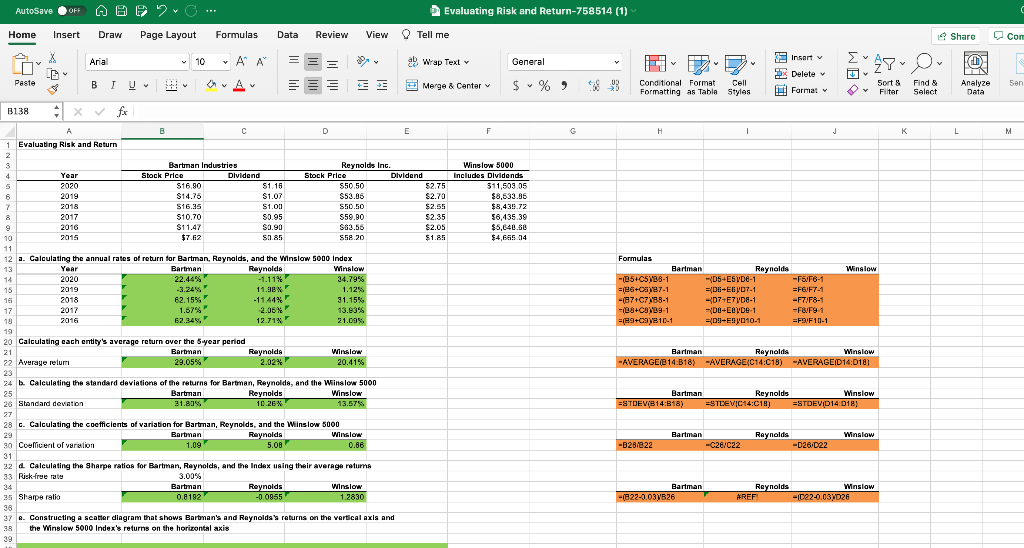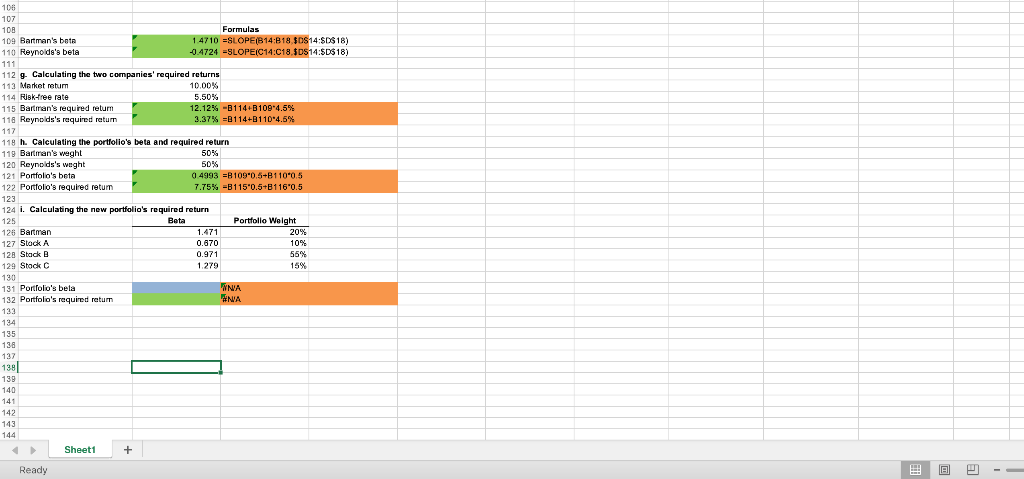


Reynolds's beta: -0.4724 W Are these betas consistent with your graph? These betas are consistent with the scatter diagrams. g. Assume that the risk-free rate on long-term Treasury bonds is 5.5%. Assume also that the average annual return on the Winslow 5000 is not a good estimate of the market's required return-it is too high. So use 10% as the expected return on the market. Use the SML equation to calculate the two companies' required returns. Round your answer to two decimal places. Bartman's required return: 12.12 % Reynolds's required return: 3.37 % h. If you formed a portfolio that consisted of 50% Bartman and 50% Reynolds, what would the portfolio's beta and required return be? Round your answer for the portfolio's bet to four decimal places and for the portfolio's required return to two decimal places. Portfolio's beta: 0.4993 Portfolio's required return: 7.75 % % i. Suppose an investor wants to include Bartman Industries's stock in his portfolio. Stocks A, B, and C are currently in the portfolio, and their betas are 0.670, 0.971, and 1.279 respectively. Calculate the new portfolio's required return if it consists of 20% of Bartman, 10% of Stock A, 55% of Stock B, and 15% of Stock C. Round your answer to two decimal places % Check My Work Reset Problem AutoSave OFF AGO. Evaluating Risk and Return-758514 (1) Home Insert Draw Page Layout Formulas Data Review View Tell me - Share Con Insert Arial X LA 10 A A ag Wrap Text General ' Ich) DX Delete Paste BTU A $ % ) Merge & Center Sen Conditional Format Cell Formatting as Table Styles Format Sort & Filter Find & Select Analyze Data Y B138 : * fx F G H 1 J K L M $2.75 Winslow 5000 Includes Dividends $11,503.05 $8,633.95 $8,439.72 56,135.39 $5,640.80 $4,665.94 A B D E 1 Evaluating Risk and Return 2 3 Bartman Industries Reynolds Inc. 4 Year Stock Price Dividend Stock Price Dividend 5 2020 $16.90 $ S1.16 $50.50 6. 2019 $14.75 $1.07 S53.86 $2.70 7 2018 S16.35 S1.001 550.50 $2.55 8 2017 $10.70 $0.95 $59.00 $2.35 2016 $11.47 $0.90 S83.56 $2.05 10 2015 $7.62 50.85 S58.20 $1.85 11 12 a. Calculating the annual rates of return for Bartman, Reynolds, and the Winslow 5000 Index 13 Year Bartman Reynolds Winslow 14 2020 22.449 -1.11% 34.79% 15 2019 -3.24% % % 1.12% 16 2018 62.15% -1144% 31.15% 17 2017 1.57% 2.05 13.63% 18 2016 62.34%, 12.71% 21.09% 19 20 Calculating each entity's average return over the year period 21 Bartman Reynolds Winslow 22 Avuraye relum 29.05% % 2.02% 20.41% 23 24 b. Calculating the standard deviations of the returns for Bartman, Raynolds, and the Winslow 5000 25 Bartman Reynolds Winslow 26 Standard deviation 31.83 10.26% 13.57% Winslow 11.98 Formulas Bartman -(25+C5988-1 =26+05987-1 O6V87-1 -(07C7Y88-1 - 23+C8B9-1 =(E9+099810-1 Reynolds -D5-E5VD-1 -F8F6-1 ={DE-E6y07-1 =F6/F7-1 - 07+E7VD8-1 -F78F8-1 ={D6-EVD-1 -F8/F91 ={09+E9010-1 =F3JF101-1 Bartman Winslow Reynolds -AVERAGE/C14:B18) -AVERAGE/C14C18) -AVERAGED14:018) ( / Bartman Reynolds Winslow =STDEV(B14:18) ESTDEVIC14:018) ESTDEVID 14:018) Winslow -B28/ 822 Bartman -C26/C22 Reynolds -D28D22 28 C. Calculating the coefficients of variation for Bartman, Reynolds, and the Winslow 5000 29 Bartman Reynolds Winslow 30 Coellicent of variation 1.09 5.08 0.86 31 22 Calculating the Sharpe ratios for Bartman, Reynolds, and the Index using their average ratura 33 Risk-free rate 3.00% 34 Bartman Reynolds Winslow 25 Sharpe rallo 0.8192 -0.0955 1.2830 38 37 6. Constructing a scatter diagram that shows Bartman's and Reynolds's returns on the vertical axis and the Winslow 5000 Index's returns on the horizontal axis 39 Bartman -1822-0.034526 Reynolds Winslow AREF -1022-0.037026 5.50% 106 107 108 Formulas 109 Bartman's bota 1.4710 ESLOPE(B14:818.$D$14:$D$18) 110 Reynolda's beta -0.4724 =SLOPE(C14:C18.$D$14:$D$18) 111 112 g Calculating the two companies' required returns 113 Market return 10.00% 114 Risk-free rate 115 Bartman's required return 12.12% -31144B109-4.5% 116 Reynolds's required ratum 3.37% =B114+110*4.5% 117 119 h. Calculating the portfolio's bets and required return 119 Bartman's waght 50% 120 Reynolds's weght 50% 121 Portfolio's beta 0.4993 =B109"0.6-8110*0.5 122 Portfolio's required return 7.75% =B115*0.5+116'0.5 123 124 i. Calculating the new portfolio's required return 125 Bata Portfolio Weight 126 Bartman 1.471 20% 127 Stock A 0.670 10% 128 Stack B 0.971 56% 129 Stock C 1.279 15% 130 131 Portfolio's bela WNA 132 Portfolio's required retum NA 133 134 135 138 137 138 139 140 141 142 143 144 Sheet1 + Ready B


