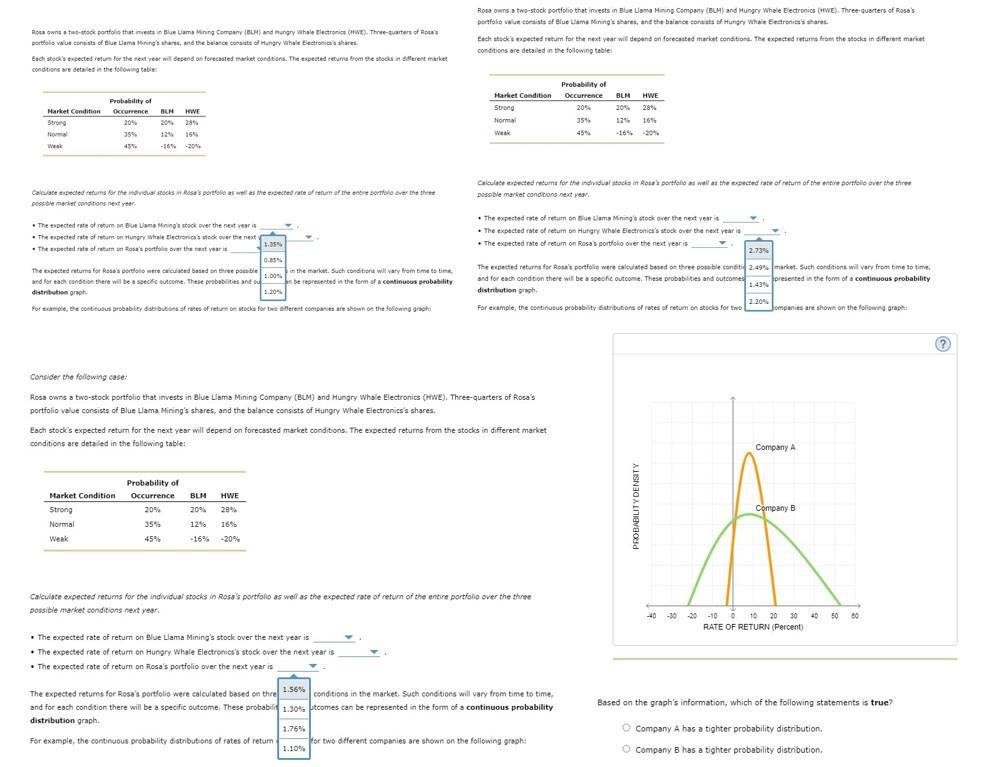
Rosa owns t-stock portfolio that is in Lama Mining Company (BL) and angry whole Electronics (re). Three-waters of Rotas portfolio value of Blue Lam Ming, and the balance consists of Hungry Whale edonia's shares Esch stocks expected return for the next year wil depend on Forecasted market condition. The expected return from the stock interest market conditions are detailed in the following table: Rosa owns a two-stock portfolio that invests in Blue Lana Mining Company (BUM) and Hungry Whale Electronics CHWE). Three-quarters of Rose's portfolio value consists of Blue Lame Mining shares, and the balance consists of Hungry Whale Electronics's share Each stock's expected return for the next year will depend on forecasted market condition. The expected returns from the stocks in different market conditions are detailed in the following tables Probability of Market Condition Occurrence BMHWE Strong 204 NO 359 155 West 4545 -145-2014 Probability of Market Condition Occurrence BLMHWE Strong 20% 20% 28% Normal 35% 124 16% Week 45 Calate expected retums for the individual stocks Rosas portello as well as the expected rate ofreu al me entre prove the three n retum entire possible market conditions next year Calculate expected returns for the individual stocks in Rose's portfolio as well as the expected rate of return of the entire portfolio over the three possible market conditions next year . The expected rate of return on Blue Lana Ming's stock over the next year is The acted rate of return on Hungry Whale Thectronics stock over the next . . The expected to return Rosa's portfolio over the next year is GS The expected retums for Rose's portfolio were calculated based on three puble.com in the market. Such conditions will vary from time to time. and for each condition there will be aspecte outcome. These probabilities and bir be represented in the form of a continuous probability distribution graph 1.204 For example, the costituus probability shibutions of rates of return on stocks for two oferent companies are shown on the following graph . The expected rate of return on Blue Lima Mining stock over the next years . The expected rate of return on Hungry Whale Electronics's stock over the next year is The expected rate of return on Rosa's portfolio over the next year is 2.73% The expected returns for Rose's portfolio were calculated based on three possible condit2.49% marice. Such conditions wil vary from time to time and for each condition there will be a specific outcome. These probabilities and outcomes.439 presented in the form of a continuous probability distribution graph 2.204 For example, the continuous probability distribution of rates of retum on stocks for two ompanies are shown on the following grape Consider the following case: Rosa owns a two-stock portfolio that invests in Blue Lama Mining Company (BLM) and Hungry whole Electronics (HWE). Three-quarters of Rosa's portfolio value consists of Blue Llama Mining's shares, and the balance consists of Hungry Whale Electronics's shares, Each stock's expected return for the next year will depend on forecasted market conditions. The expected returns from the stocks in different market . conditions are detailed in the following tables Company A BLM HWE Probability of Occurrence 20% 35% 45% Market Condition Strong Normal Weak Company B 2096 2894 125 169 -16% -20% Calculate expected returns for the individual stocks in Rosa's portfolio as well as the expected rate of return of the entire portfolio over the three possible market conditions next year. -40-3020-100 10 20 30 RATE OF RETURN (Percent) 40500 40 50 The expected rate of return on Blue Llama Mining's stock over the next year is . The expected rate of return on Hungry Whale Electronies's stock over the next year is The expected rate of return on Rosa's portfolio over the next year is Based on the graph's information, which of the following statements is true? The expected returns for Rosa's portfolio were calculated based on the 1.56% conditions in the market. Such conditions will vary from time to time, and for each condition there will be a specific outcome. These probabil 1.30% ptcomes can be represented in the form of a continuous probability distribution graph 1.76% For example, the continuous probability distributions of rates of return For two different companies are shown on the following graph: Company A has a tighter probability distribution. Company B has a tighter probability distribution


