

Answered step by step
Verified Expert Solution
Question
1 Approved Answer
Royal Bank of Canada is the company... im not sure how to do this and could use any kind of help! Project Write-Up . Page
Royal Bank of Canada is the company...
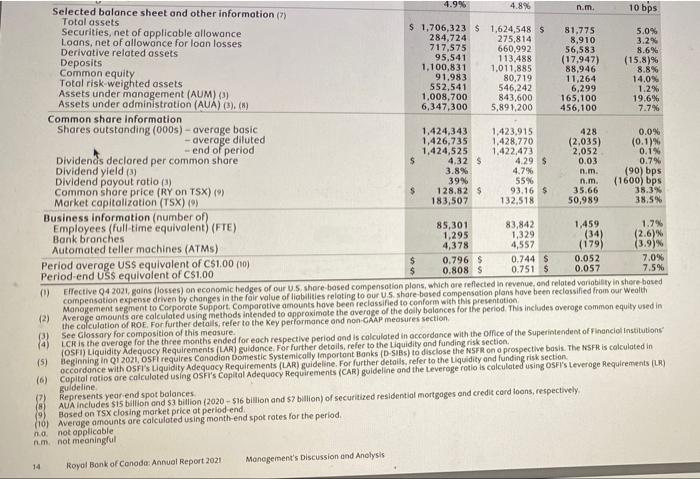
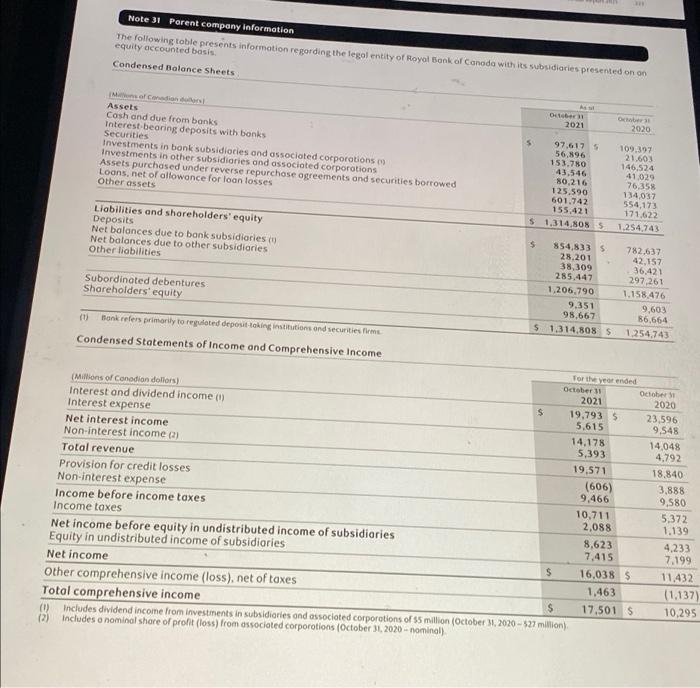
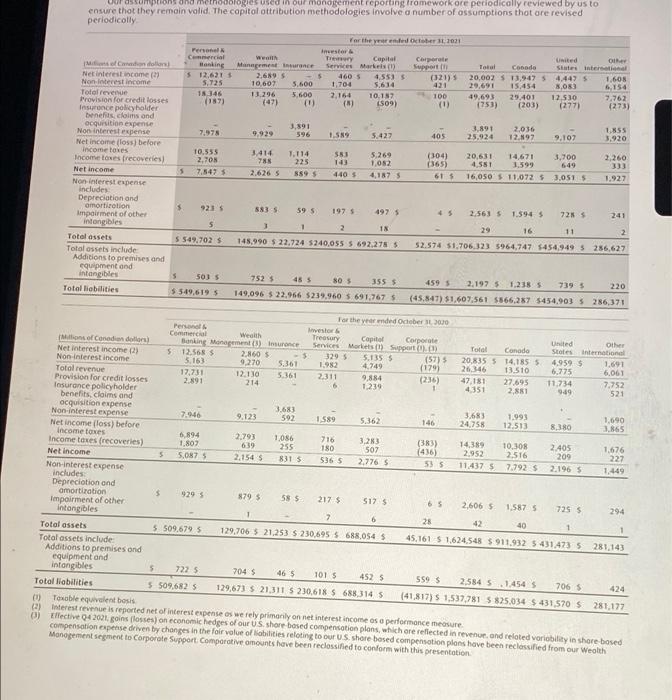
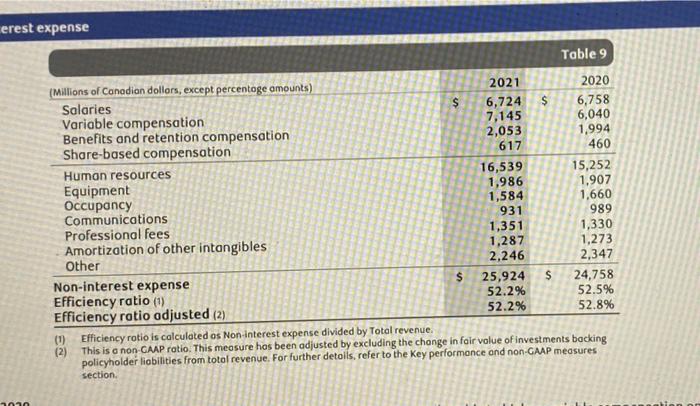
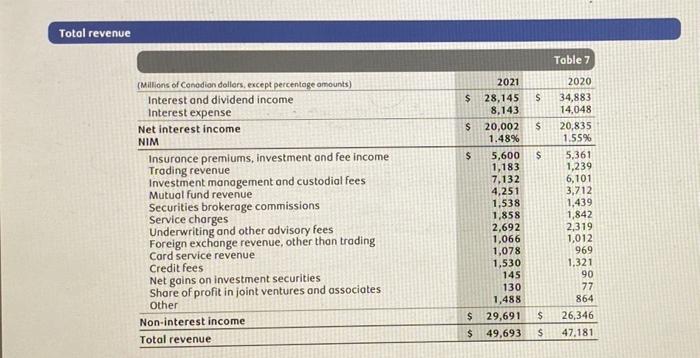
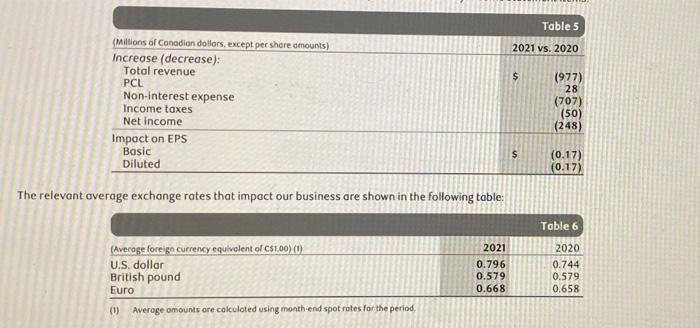
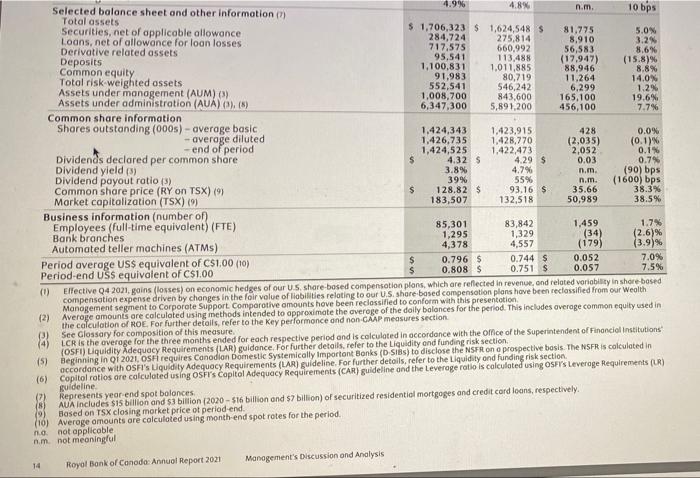
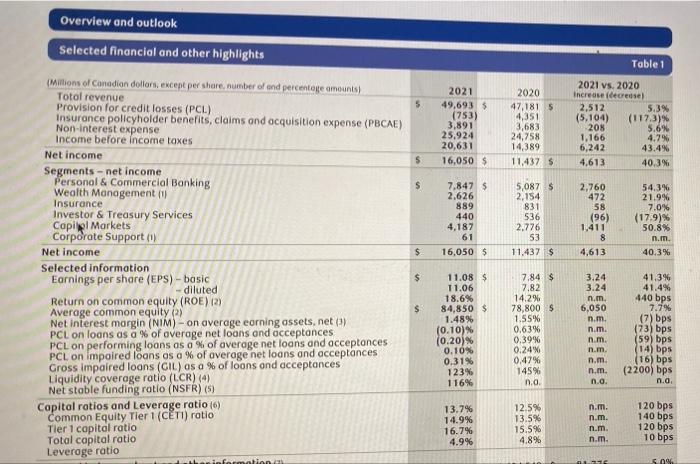
Project Write-Up . Page 1: Introduce the company's most recent year, by writing a short paragraph. This paragraph will not describe the company (you will assume that the reader knows about the company), but rather you will write a few things that have happened in the company, during its most recent year. Page 1: name four financial ratios that you would like to use, to analyze your company. Write a brief sentence, telling the reader what each ratio will reveal about the company. Your analysis should have a variety of ratios (one or two solvency ratios, one liquidity ratio, one or two profitability ratios, for example); please check with your instructor if you are not sure which ratios to select. Pages 2 & 3: assess your company using each of the four financial ratios above. Succinctly write the ratio formula. Calculate your company's ratio using the current year's numbers (from the annual report) AND calculate the same ratio using numbers from the previous year. Include the date of the numbers that you use to calculate the ratio (month/year). For some companies, this might be October 2018 and October 2019, if a company has a fiscal year-end of October 30, for example. For other companies, you might be able to access 2020 leports, with financial ratios from March 2019 and March 2020, for example. Page 4: Write two, separate, brief paragraphs with your financial analysis, based on the results of the four ratios. Do the ratios show improvement in the financial health of the company? Explain (briefly) why or why not. 0.79 Selected balance sheet and other information (7) 4.9% 4.8% n.m. 10 bps Total assets Securities, net of applicable allowance $ 1,706,323 $ 1,624,548 $ 81.775 5.0% 284,724 Loans, net of allowance for loan losses 275,814 8,910 3.2% Derivative related assets 717,575 660,992 56,583 8.6% Deposits 95,541 113.488 (17.947) (15.8)% 1.100,831 Common equity 1,011,885 88.946 8.8% Total risk weighted assets 91.983 80.719 11,264 14.0% 552,541 Assets under management (AUM) (3) 546,242 6,299 1.2% Assets under administration (AUA) O). (*) 1,008,700 843,600 165,100 19.6% 6,347,300 5,891,200 456,100 7.7% Common share information Shares outstanding (000s) - average basic 1.424,343 1,423,915 428 0.0% - average diluted 1,426,735 1,428,770 (2,035) (0.1) - end of period 1,424,525 1.422,473 2,052 0.1% Dividends declared per common shore $ 4.32 $ 4.29 $ Dividend yield (3) 0.03 3.8% 4.7% n.m. (90) bps Dividend payout rotio (3) 39% 55% n.m. (1600) bps Common share price (RY on TSX) () $ 128.82 $ 93.16 $ 35.66 38.3% Market capitalization (TSX) (%) 183,507 132,518 50,989 38.5% Business information (number of Employees (full-time equivalent) (FTE) 85,301 83,842 1,459 1.7% Bank branches 1,295 (2.6) Automated teller machines (ATM) 4,378 4,557 (179) (3.9) Period average USS equivalent of C$1.00 (10) $ 0.796 $ 0.744 $ 0.052 7.0 Period end USS equivalent of CS1.00 0.808 S 0.751 $ 0.057 7.5% (0) Effective Q4 2021, goins forses) on economic hedges of our U.S.share-based compensation plons, which are reflected in revenue and related variability in shore bored compensation expense driven by changes in the fair value of liabilities relating to our US share based compensation plans have been reclassified from our Wealth Management segment to Corporate Support. Comparative amounts have been reclassified to conform with his presentation (2) Average amounts are calculated using methods intended to approximate the average of the dolly balances for the period. This includes average common equity used in the calculation of HOE. For further details, refer to the Key performance and non-GAAP measures section (3) See Glossary for composition of this measure. (4) LCR is the average for the three months ended for each respective period and is calculated in accordance with the office of the Superintendent of Financial institutions (OSFI) Liquidity Adequacy Requirements (LAR) guidance. For further details, refer to the Liquidity and funding risk section (5) Beginning in Q1 2021. OsFirequires Conodion Domestic Systemically important Banks (DSB) to disclose the NSFR on a prospective basis. The SFR is calculated in occordance with OSFI's Liquidity Adequacy Requirements (LAR) guideline. For further details, refer to the Liquidity and funding risk section (6) Capitol ratios are calculated using OSF's Capital Adequacy Requirements (CAR) guideline and the Leverage ratio is calculated using OSFI's Leverage Requirements (LR) guideline (7) Represents year-end spot balonces (8) AUA includes sis billion and 53 billion (2020 - $16 billion and $7 billion) of securitired residential mortgages and credit card loons, respectively (9) Based on TSX closing market price at period end 16) Average amounts are calculated using month-end spot rotes for the period no not applicable m. not meaningful Monagement's Discussion and Analysis 14 Royal Bank of Conodo: Annual Report 2021 1.329 (34) Note 31 Parent company information The following tobe presents information regarding the legal entity of Royal Bank of Canada with its subsidiaries presented on on equity accounted basis Condensed Balance Sheets Assets 2021 2020 Cash and due from banks Interest-bearing deposits with bonks 97.6175 109.397 Securities 56.896 21.603 Investments in bonk subsidiaries and associated corporations 153.780 146.524 Investments in other subsidiaries and associated corporations 43,546 41.029 Assets purchased under reverse repurchase agreements and securities borrowed 80,216 76,358 Loans, net of allowance for loan losses 125,590 134037 Other assets 601.742 554,173 155,421 171.622 Liabilities and shareholders' equity $ 1,314,8085 1.254,743 Deposits Net balonces due to bank subsidiaries $ 854,833 5 782637 Net balances due to other subsidiaries 28.201 42,157 Other liabilities 38,309 36.421 285,447 297.261 Subordinated debentures 1.206.790 1.158.476 Shareholders' equity 9.351 9,603 98,667 86,664 $ 1,314,8085 mu Bank refers primarily to redted deposit taking institutions and securities 1.254.743 Condensed Statements of Income and comprehensive Income For the year ended October October (Millions of Canadian dollars) 2021 2020 Interest and dividend income (1) $ 19,7935 23,596 Interest expense 5,615 9,548 Net interest income 14,178 14.048 Non-interest income (2) 5,393 4,792 Total revenue 19.571 18,840 Provision for credit losses (606) 3,888 Non-interest expense 9.466 9,580 Income before income taxes 10,711 5,372 Income taxes 2,088 1.139 Net income before equity in undistributed income of subsidiaries 8.623 4,233 Equity in undistributed income of subsidiaries 7.415 7.199 Net income $ 16,038 $ 11.432 Other comprehensive income (loss), net of taxes 1,463 (1.137) Total comprehensive income $ 17.501 $ 10,295 (0) Includes dividend income from investments in subsidiaries and associated corporations of 5 million (October 31, 2020 - 527 million) (2) Includes a nominal shore of profit (loss) from associated corporations (October 31, 2020-nominal) ensure that they remain valid. The capitolottribution methodologies involve a number of assumptions thot ore revised prions and methodologies and our monorement reporting fromework ore periodically reviewed by us to periodically Per Camercial $ 12,621 5.725 1346 (187) For the year and October 2011 Ines ww They Capital Management Insurance Corte Services Market Support 2.689 $ 5 4605 4,5535 10,607 (321) 5.600 1,704 5.614 421 13.296 5.600 2,164 10.157 100 (47) (1) 1509) (1) United Total Conado States inter 20.002S 13,947 5 4.4475 1.605 29.691 15.454 SORT 6.154 49.693 29.401 12.530 7,762 1753) (203) (277) (273) 9,929 3,891 596 1.59 5.422 405 3.891 25.924 2,036 12.N92 9.107 1,855 3.920 10.555 2.703 7.8475 Misol Candles Net interest income (2) Non interest income Total revenue Provision for credit losses Insurance policyholder benefits claims and acquisition expense Non interest expense Net income foss) before income taxes Income taxes recoveries) Net income Non interest expense includes Depreciation and amortization Impairment of other Intangibles Total assets Total ossets include Additions to premises and equipment and intangibles Total liabilities 3.414 788 2.6265 1.114 225 889 $ 553 1:03 5.269 1.082 4,1875 (304) (365) 615 20,631 14.671 4.551 1.599 16,050 11.072 5 1,700 649 3,0515 5 2,260 333 1.927 4405 $ 9215 5835 59 $ 1975 2.5635 1.5945 725 241 3 1 2 18 29 16 11 2 5549.702 $ 145.990 $ 22.724 $240.055 5 692.2755 52.574 51.706.323 5964,747 5454,949 5 286,627 5 5035 5549.619 5 455 805 355 149,096 $ 22.966 5239,960 $ 691,767 S 4595 2.1975 1.2385 7395 220 (45.847) $1.607,561 5866.287 5454,903 5 286,371 523 (383) 180 For the year ended Odober 3030 Personal Investors Comercial Wealth Treasury Capitol Corporate United Monte Canadian doll Other Banking Management (3) Insurance Services Markets (0) Support Total Conado Stotes International Net interest income (2) 5 12.568 2.860 5 3295 5.135 5 (57) 20,835 5 14,1855 4.9595 1.691 Non-Interest income 3.163 9270 5.361 1.982 4.749 (179) 26346 13.510 6.775 6.061 Total revenue 17.731 12.130 5.361 2.311 9.884 (236) 47.181 27.695 11.734 7.752 Provision for credit losses 2.891 214 6 1.239 1 4351 2,881 9:49 Insurance policyholder benefits. claims and acquisition expense 3.683 3,683 Non-interest expense 1.993 7.946 9.123 592 1589 5.362 1,690 146 24,758 12.513 8,380 3.865 Net income foss) before income taxes 6.894 2.793 1,086 716 3,283 Income taxes (recoveries) 14.389 1.807 639 255 10,308 2.405 1.676 507 (436) 2.952 2,516 209 227 Net Income 5 5.0875 2.1545 8315 5365 2.776 5 585 11.4375 7.7925 2.1965 1,449 Non-interest expense includes Depreciation and amortization $ 929 5 8795 58 5 2175 5125 Impairment of other 2,6065 1.5875 7255 294 Intangibles 1 7 6 28 42 40 1 1 Total assets 5509.679 129,706 5 21.253 S 230,695 5.688.0545 45.161 $ 1.624548 911.932 5431,423 5 281.143 Total assets include: Additions to premises and equipment and intangibles 7225 7045 46 5 101 5 4525 5595 2.5845 1.4545 706 5 Total liabilities 5509,682 5 129.673 $ 21.311 $ 230,618 S 688 314 5 (41.817) $ 1.537,781 5 825,034 5431,570 281,177 (1) Table equivalent bosis (2) Interest revenue is reported neto interest expense as we rely primarily on neinterest income ose performance measure OD Effective 04 2021. going losses) on economic hedges of our US shore based compensation plons, which are reflected in revenue and related variabilety in shore bosed compensation expense driven by changes in the fair value of abilities relating to our US shore based compensation plans have been reclassified from our Wealth Management segment to Corporate Support Comparative amounts have been reclassified to conform with this presentation erest expense Table 9 (Millions of Canadian dollars, except percentoge amounts) 2021 2020 Salaries $ 6,724 $ 6,758 Variable compensation 7,145 6,040 Benefits and retention compensation 2,053 1,994 Share-based compensation 617 460 Human resources 16,539 15,252 Equipment 1,986 1.907 Occupancy 1,584 1,660 Communications 931 989 Professional fees 1,351 1,330 Amortization of other intangibles 1,287 1,273 Other 2,246 2,347 Non-interest expense $ 25,924 $ 24,758 Efficiency ratio (1) 52.2% 52.5% Efficiency ratio adjusted (2) 52.2% 52.8% (1) Efficiency rotio is calculated as Non interest expense divided by Total revenue (2) This is a non CAAP ratio. This measure has been adjusted by excluding the change in fair value of investments backing policyholder liabilities from total revenue. For further details, refer to the Key performance and non-GAAP measures section, $ 101 Total revenue Table 7 S $ S (Millions of Conodion dollars, except percentage amounts) Interest and dividend income Interest expense Net interest Income NIM Insurance premiums, investment and fee income Trading revenue Investment management and custodial fees Mutual fund revenue Securities brokerage commissions Service charges Underwriting and other advisory fees Foreign exchange revenue, other than trading Card service revenue Credit fees Net gains on investment securities Share of profit in joint ventures and associates Other Non-interest income Total revenue 2021 $ 28,145 8,143 $ 20,002 1.48% $ 5,600 1,183 7,132 4,251 1,538 1,858 2,692 1,066 1,078 1,530 145 130 1,488 $ 29,691 $ 49,693 2020 34,883 14.048 20,835 1.55% 5,361 1,239 6,101 3,712 1,439 1,842 2,319 1,012 969 1.321 90 77 864 26,346 47,181 $ $ Table 5 2021 vs. 2020 $ (Millions of Canadian dollars, except per shore amounts) Increase (decrease): Total revenue PCL Non-interest expense Income taxes Net income Impact on EPS Basic Diluted (977) 28 (707) (50) (248) $ (0.17) (0.17) The relevant average exchange rates that impact our business are shown in the following table: Table 6 (Average foreign currency equivalent of CS1.00) (0) U.S. dollar British pound Euro (1) Averoge amounts are calculated using month-end spot rates for the period 2021 0.796 0.579 0.668 2020 0.744 0.579 0.658 10 bps Selected balance sheet and other information 4.99% 4.8% n.m. Total assets Securities, net of applicable allowance $ 1,706,323 $ 1,624,548 S 81.775 5.0% Loans, net of allowance for loan losses 284,724 275,814 8,910 3.2 Derivative related assets 717,575 660,992 56,583 8.6% Deposits 95,541 113,488 (17.947) (15.8% 1.100,831 Common equity 1,011,885 88,946 8.8% Total risk weighted assets 91.983 80,719 11.264 14.0% Assets under management (AUM)0) 552,541 546,242 6,299 1.2% Assets under administration (AUA) ), (8) 1,008,700 843,600 165,100 19.6% 6,347,300 5,891,200 456,100 7.7% Common share information Shores outstanding (000s) - average basic 1.424,343 1,423,915 428 0.0% average diluted 1,426,735 1,428,770 (2,035) (0.1) end of period 1,424,525 1.422,473 2,052 0.1% Dividends declared per common share $ 4.32 5 Dividend yield (3) 4.29 $ 0.03 0.7% 3.8% 4.7% n.m. Dividend payout ratio (3) (90) bps 39% 55% n.m. Common share price (RY on TSX) (9) (1600) bps S 128.82 $ 93.16 $ 35.66 38.3% Morket capitalization (TSX) (9) 183,507 132,518 50,989 38.5% Business information (number on Employees (full-time equivalent) (FTE) 85,301 83,842 1.459 1.7% Bank branches 1,295 1,329 (34) (2.6)% Automated teller machines (ATMs) 4,378 4,557 (179) (3.9)% Period average US$ equivalent of CS1.00 (10) $ 0.7965 0.744 $ 0.052 7.0% Period-end USS equivalent of C$1.00 0.808 $ 0.751 S 0.057 (1) Elfective Q4 2021. gains (losses) on economic hedges of our US share-bosed compensation plans, which are reflected in revenue and related variability in shore-based compensation expense driven by changes in the for value of liabilities relating to our U.S. share based compensation plans have been reclassified from our Wealth Monogement segment to Corporate Support Comparative amounts have been reclassified to conform with this presentotion (2) Averoje amounts are calculated using methods intended to approximate the averoge of the daily balonces for the period. This includes average common equity used in the calculation of ROE. For further details, refer to the key performance and non-GAAP measures section (3) See Glossary for composition of this measure (4) LCR is the overage for the three months ended for each respective period and is calculated in accordance with the office of the Superintendent of Financial institutions (OSFI) Liquidity Adequacy Requirements (LAR) guidance. For further details, reler to the Liquidity and funding risk section (5) Beginning in Q1 2021. OSH requires Canodion Domestic Systemically important Bonks (DSi) to disclose the NSFR on a prospective basis. The NSFR is calculated in occordance with OSF's Liquidity Adequacy Requirements (LAR) guideline. For further details, refer to the Liquidity and funding risk section (6) Copitol rotios ore calculated using osfr's Capital Adequacy Requirements (CAR) guideline and the Leverage ratio is calculated using OSF's Leverage Requirements (UR) guideline (7) Represents year end spot bolonces (8) AUA includes $15 billion and $3 billion 2020 - $16 billion and s7 billion) of securitized residential mortgages and credit card loons, respectively. (9) Based on TSX closing market price ot period end. (16) Average amounts are calculated using month-end spot rates for the period. no not applicable nm not meaningful Management's Discussion and Analysis 14 Royal Bank of Conodo: Annual Report 2021 7.5% Overview and outlook Selected financial and other highlights Table 1 5 2021 49,693 $ (753) 3,891 25.924 20,631 16,050 $ 2020 47,181 5 4,351 3,683 24,758 14,389 11.4375 2021 vs. 2020 Increase (decrease 2.512 5.3% (5,104) (117.3) 208 5.6% 1,166 4.79 6,242 43.4% 4,613 40.3% $ $ 7,847 $ 2.626 889 440 4.187 61 16,050 $ 5,087 $ 2,154 831 536 2.776 53 11.437 $ 2,760 472 58 (96) 1,411 8 54.3% 21.9% 7.0% (17.9% 50.8% n.m. 40.3% $ 4,613 (Millions of Canadian dollars, excepe per share, number of and percentage amounts) Totol revenue Provision for credit losses (PCL) Insurance policyholder benefits, claims and acquisition expense (PBCAE) Non-interest expense Income before income taxes Net income Segments - net income Personal & Commercial Banking Wealth Management Insurance Investor & Treasury Services Copilul Markets Corporate Support Net income Selected information Earnings per share (EPS) - basic diluted Return on common equity (ROE) 12) Average common equity (2) Net interest margin (NIM) - on average earning assets.net PCL on loans as a % of average net loons and acceptances PCL on performing loons as a % of average net loans and acceptances PCL on Impaired loans os a % of overoge net loans and acceptances Gross impaired loans (GI) as a % of loons and acceptances Liquidity coverage ratio (LCR) (4) Net stable funding ratio (NSFR) (8) Capitol ratios and Leverage ratio (6) Common Equity Tier 1 (CETI) ratio Tier 1 capital ratio Total capital ratio Leverage ratio formation $ $ 11.08 $ 11.06 18.6% 84,850 $ 1.48% (0.10)% (0.20)% 0.10% 0.31% 123% 116% 7.84 $ 7.82 14.2% 78,800 $ 1.55% 0.63% 0.39% 0.24% 0.47% 145% n.o. 3.24 3.24 n.m. 6,050 n.m. n.m. n.m. n.m. n.m n.m. no 41.3% 41.4% 440 bps 7.7% (7) bps (73) bps (59) bps (14) bps (16) bps (2200) bps n.a 13.7% 14.9% 16.7% 4.9% 12.5% 13.5% 15.5% 4.8% n.m. n.m. n.m n.m. 120 bps 140 bps 120 bps 10 bps --- 59 Project Write-Up . Page 1: Introduce the company's most recent year, by writing a short paragraph. This paragraph will not describe the company (you will assume that the reader knows about the company), but rather you will write a few things that have happened in the company, during its most recent year. Page 1: name four financial ratios that you would like to use, to analyze your company. Write a brief sentence, telling the reader what each ratio will reveal about the company. Your analysis should have a variety of ratios (one or two solvency ratios, one liquidity ratio, one or two profitability ratios, for example); please check with your instructor if you are not sure which ratios to select. Pages 2 & 3: assess your company using each of the four financial ratios above. Succinctly write the ratio formula. Calculate your company's ratio using the current year's numbers (from the annual report) AND calculate the same ratio using numbers from the previous year. Include the date of the numbers that you use to calculate the ratio (month/year). For some companies, this might be October 2018 and October 2019, if a company has a fiscal year-end of October 30, for example. For other companies, you might be able to access 2020 leports, with financial ratios from March 2019 and March 2020, for example. Page 4: Write two, separate, brief paragraphs with your financial analysis, based on the results of the four ratios. Do the ratios show improvement in the financial health of the company? Explain (briefly) why or why not. 0.79 Selected balance sheet and other information (7) 4.9% 4.8% n.m. 10 bps Total assets Securities, net of applicable allowance $ 1,706,323 $ 1,624,548 $ 81.775 5.0% 284,724 Loans, net of allowance for loan losses 275,814 8,910 3.2% Derivative related assets 717,575 660,992 56,583 8.6% Deposits 95,541 113.488 (17.947) (15.8)% 1.100,831 Common equity 1,011,885 88.946 8.8% Total risk weighted assets 91.983 80.719 11,264 14.0% 552,541 Assets under management (AUM) (3) 546,242 6,299 1.2% Assets under administration (AUA) O). (*) 1,008,700 843,600 165,100 19.6% 6,347,300 5,891,200 456,100 7.7% Common share information Shares outstanding (000s) - average basic 1.424,343 1,423,915 428 0.0% - average diluted 1,426,735 1,428,770 (2,035) (0.1) - end of period 1,424,525 1.422,473 2,052 0.1% Dividends declared per common shore $ 4.32 $ 4.29 $ Dividend yield (3) 0.03 3.8% 4.7% n.m. (90) bps Dividend payout rotio (3) 39% 55% n.m. (1600) bps Common share price (RY on TSX) () $ 128.82 $ 93.16 $ 35.66 38.3% Market capitalization (TSX) (%) 183,507 132,518 50,989 38.5% Business information (number of Employees (full-time equivalent) (FTE) 85,301 83,842 1,459 1.7% Bank branches 1,295 (2.6) Automated teller machines (ATM) 4,378 4,557 (179) (3.9) Period average USS equivalent of C$1.00 (10) $ 0.796 $ 0.744 $ 0.052 7.0 Period end USS equivalent of CS1.00 0.808 S 0.751 $ 0.057 7.5% (0) Effective Q4 2021, goins forses) on economic hedges of our U.S.share-based compensation plons, which are reflected in revenue and related variability in shore bored compensation expense driven by changes in the fair value of liabilities relating to our US share based compensation plans have been reclassified from our Wealth Management segment to Corporate Support. Comparative amounts have been reclassified to conform with his presentation (2) Average amounts are calculated using methods intended to approximate the average of the dolly balances for the period. This includes average common equity used in the calculation of HOE. For further details, refer to the Key performance and non-GAAP measures section (3) See Glossary for composition of this measure. (4) LCR is the average for the three months ended for each respective period and is calculated in accordance with the office of the Superintendent of Financial institutions (OSFI) Liquidity Adequacy Requirements (LAR) guidance. For further details, refer to the Liquidity and funding risk section (5) Beginning in Q1 2021. OsFirequires Conodion Domestic Systemically important Banks (DSB) to disclose the NSFR on a prospective basis. The SFR is calculated in occordance with OSFI's Liquidity Adequacy Requirements (LAR) guideline. For further details, refer to the Liquidity and funding risk section (6) Capitol ratios are calculated using OSF's Capital Adequacy Requirements (CAR) guideline and the Leverage ratio is calculated using OSFI's Leverage Requirements (LR) guideline (7) Represents year-end spot balonces (8) AUA includes sis billion and 53 billion (2020 - $16 billion and $7 billion) of securitired residential mortgages and credit card loons, respectively (9) Based on TSX closing market price at period end 16) Average amounts are calculated using month-end spot rotes for the period no not applicable m. not meaningful Monagement's Discussion and Analysis 14 Royal Bank of Conodo: Annual Report 2021 1.329 (34) Note 31 Parent company information The following tobe presents information regarding the legal entity of Royal Bank of Canada with its subsidiaries presented on on equity accounted basis Condensed Balance Sheets Assets 2021 2020 Cash and due from banks Interest-bearing deposits with bonks 97.6175 109.397 Securities 56.896 21.603 Investments in bonk subsidiaries and associated corporations 153.780 146.524 Investments in other subsidiaries and associated corporations 43,546 41.029 Assets purchased under reverse repurchase agreements and securities borrowed 80,216 76,358 Loans, net of allowance for loan losses 125,590 134037 Other assets 601.742 554,173 155,421 171.622 Liabilities and shareholders' equity $ 1,314,8085 1.254,743 Deposits Net balonces due to bank subsidiaries $ 854,833 5 782637 Net balances due to other subsidiaries 28.201 42,157 Other liabilities 38,309 36.421 285,447 297.261 Subordinated debentures 1.206.790 1.158.476 Shareholders' equity 9.351 9,603 98,667 86,664 $ 1,314,8085 mu Bank refers primarily to redted deposit taking institutions and securities 1.254.743 Condensed Statements of Income and comprehensive Income For the year ended October October (Millions of Canadian dollars) 2021 2020 Interest and dividend income (1) $ 19,7935 23,596 Interest expense 5,615 9,548 Net interest income 14,178 14.048 Non-interest income (2) 5,393 4,792 Total revenue 19.571 18,840 Provision for credit losses (606) 3,888 Non-interest expense 9.466 9,580 Income before income taxes 10,711 5,372 Income taxes 2,088 1.139 Net income before equity in undistributed income of subsidiaries 8.623 4,233 Equity in undistributed income of subsidiaries 7.415 7.199 Net income $ 16,038 $ 11.432 Other comprehensive income (loss), net of taxes 1,463 (1.137) Total comprehensive income $ 17.501 $ 10,295 (0) Includes dividend income from investments in subsidiaries and associated corporations of 5 million (October 31, 2020 - 527 million) (2) Includes a nominal shore of profit (loss) from associated corporations (October 31, 2020-nominal) ensure that they remain valid. The capitolottribution methodologies involve a number of assumptions thot ore revised prions and methodologies and our monorement reporting fromework ore periodically reviewed by us to periodically Per Camercial $ 12,621 5.725 1346 (187) For the year and October 2011 Ines ww They Capital Management Insurance Corte Services Market Support 2.689 $ 5 4605 4,5535 10,607 (321) 5.600 1,704 5.614 421 13.296 5.600 2,164 10.157 100 (47) (1) 1509) (1) United Total Conado States inter 20.002S 13,947 5 4.4475 1.605 29.691 15.454 SORT 6.154 49.693 29.401 12.530 7,762 1753) (203) (277) (273) 9,929 3,891 596 1.59 5.422 405 3.891 25.924 2,036 12.N92 9.107 1,855 3.920 10.555 2.703 7.8475 Misol Candles Net interest income (2) Non interest income Total revenue Provision for credit losses Insurance policyholder benefits claims and acquisition expense Non interest expense Net income foss) before income taxes Income taxes recoveries) Net income Non interest expense includes Depreciation and amortization Impairment of other Intangibles Total assets Total ossets include Additions to premises and equipment and intangibles Total liabilities 3.414 788 2.6265 1.114 225 889 $ 553 1:03 5.269 1.082 4,1875 (304) (365) 615 20,631 14.671 4.551 1.599 16,050 11.072 5 1,700 649 3,0515 5 2,260 333 1.927 4405 $ 9215 5835 59 $ 1975 2.5635 1.5945 725 241 3 1 2 18 29 16 11 2 5549.702 $ 145.990 $ 22.724 $240.055 5 692.2755 52.574 51.706.323 5964,747 5454,949 5 286,627 5 5035 5549.619 5 455 805 355 149,096 $ 22.966 5239,960 $ 691,767 S 4595 2.1975 1.2385 7395 220 (45.847) $1.607,561 5866.287 5454,903 5 286,371 523 (383) 180 For the year ended Odober 3030 Personal Investors Comercial Wealth Treasury Capitol Corporate United Monte Canadian doll Other Banking Management (3) Insurance Services Markets (0) Support Total Conado Stotes International Net interest income (2) 5 12.568 2.860 5 3295 5.135 5 (57) 20,835 5 14,1855 4.9595 1.691 Non-Interest income 3.163 9270 5.361 1.982 4.749 (179) 26346 13.510 6.775 6.061 Total revenue 17.731 12.130 5.361 2.311 9.884 (236) 47.181 27.695 11.734 7.752 Provision for credit losses 2.891 214 6 1.239 1 4351 2,881 9:49 Insurance policyholder benefits. claims and acquisition expense 3.683 3,683 Non-interest expense 1.993 7.946 9.123 592 1589 5.362 1,690 146 24,758 12.513 8,380 3.865 Net income foss) before income taxes 6.894 2.793 1,086 716 3,283 Income taxes (recoveries) 14.389 1.807 639 255 10,308 2.405 1.676 507 (436) 2.952 2,516 209 227 Net Income 5 5.0875 2.1545 8315 5365 2.776 5 585 11.4375 7.7925 2.1965 1,449 Non-interest expense includes Depreciation and amortization $ 929 5 8795 58 5 2175 5125 Impairment of other 2,6065 1.5875 7255 294 Intangibles 1 7 6 28 42 40 1 1 Total assets 5509.679 129,706 5 21.253 S 230,695 5.688.0545 45.161 $ 1.624548 911.932 5431,423 5 281.143 Total assets include: Additions to premises and equipment and intangibles 7225 7045 46 5 101 5 4525 5595 2.5845 1.4545 706 5 Total liabilities 5509,682 5 129.673 $ 21.311 $ 230,618 S 688 314 5 (41.817) $ 1.537,781 5 825,034 5431,570 281,177 (1) Table equivalent bosis (2) Interest revenue is reported neto interest expense as we rely primarily on neinterest income ose performance measure OD Effective 04 2021. going losses) on economic hedges of our US shore based compensation plons, which are reflected in revenue and related variabilety in shore bosed compensation expense driven by changes in the fair value of abilities relating to our US shore based compensation plans have been reclassified from our Wealth Management segment to Corporate Support Comparative amounts have been reclassified to conform with this presentation erest expense Table 9 (Millions of Canadian dollars, except percentoge amounts) 2021 2020 Salaries $ 6,724 $ 6,758 Variable compensation 7,145 6,040 Benefits and retention compensation 2,053 1,994 Share-based compensation 617 460 Human resources 16,539 15,252 Equipment 1,986 1.907 Occupancy 1,584 1,660 Communications 931 989 Professional fees 1,351 1,330 Amortization of other intangibles 1,287 1,273 Other 2,246 2,347 Non-interest expense $ 25,924 $ 24,758 Efficiency ratio (1) 52.2% 52.5% Efficiency ratio adjusted (2) 52.2% 52.8% (1) Efficiency rotio is calculated as Non interest expense divided by Total revenue (2) This is a non CAAP ratio. This measure has been adjusted by excluding the change in fair value of investments backing policyholder liabilities from total revenue. For further details, refer to the Key performance and non-GAAP measures section, $ 101 Total revenue Table 7 S $ S (Millions of Conodion dollars, except percentage amounts) Interest and dividend income Interest expense Net interest Income NIM Insurance premiums, investment and fee income Trading revenue Investment management and custodial fees Mutual fund revenue Securities brokerage commissions Service charges Underwriting and other advisory fees Foreign exchange revenue, other than trading Card service revenue Credit fees Net gains on investment securities Share of profit in joint ventures and associates Other Non-interest income Total revenue 2021 $ 28,145 8,143 $ 20,002 1.48% $ 5,600 1,183 7,132 4,251 1,538 1,858 2,692 1,066 1,078 1,530 145 130 1,488 $ 29,691 $ 49,693 2020 34,883 14.048 20,835 1.55% 5,361 1,239 6,101 3,712 1,439 1,842 2,319 1,012 969 1.321 90 77 864 26,346 47,181 $ $ Table 5 2021 vs. 2020 $ (Millions of Canadian dollars, except per shore amounts) Increase (decrease): Total revenue PCL Non-interest expense Income taxes Net income Impact on EPS Basic Diluted (977) 28 (707) (50) (248) $ (0.17) (0.17) The relevant average exchange rates that impact our business are shown in the following table: Table 6 (Average foreign currency equivalent of CS1.00) (0) U.S. dollar British pound Euro (1) Averoge amounts are calculated using month-end spot rates for the period 2021 0.796 0.579 0.668 2020 0.744 0.579 0.658 10 bps Selected balance sheet and other information 4.99% 4.8% n.m. Total assets Securities, net of applicable allowance $ 1,706,323 $ 1,624,548 S 81.775 5.0% Loans, net of allowance for loan losses 284,724 275,814 8,910 3.2 Derivative related assets 717,575 660,992 56,583 8.6% Deposits 95,541 113,488 (17.947) (15.8% 1.100,831 Common equity 1,011,885 88,946 8.8% Total risk weighted assets 91.983 80,719 11.264 14.0% Assets under management (AUM)0) 552,541 546,242 6,299 1.2% Assets under administration (AUA) ), (8) 1,008,700 843,600 165,100 19.6% 6,347,300 5,891,200 456,100 7.7% Common share information Shores outstanding (000s) - average basic 1.424,343 1,423,915 428 0.0% average diluted 1,426,735 1,428,770 (2,035) (0.1) end of period 1,424,525 1.422,473 2,052 0.1% Dividends declared per common share $ 4.32 5 Dividend yield (3) 4.29 $ 0.03 0.7% 3.8% 4.7% n.m. Dividend payout ratio (3) (90) bps 39% 55% n.m. Common share price (RY on TSX) (9) (1600) bps S 128.82 $ 93.16 $ 35.66 38.3% Morket capitalization (TSX) (9) 183,507 132,518 50,989 38.5% Business information (number on Employees (full-time equivalent) (FTE) 85,301 83,842 1.459 1.7% Bank branches 1,295 1,329 (34) (2.6)% Automated teller machines (ATMs) 4,378 4,557 (179) (3.9)% Period average US$ equivalent of CS1.00 (10) $ 0.7965 0.744 $ 0.052 7.0% Period-end USS equivalent of C$1.00 0.808 $ 0.751 S 0.057 (1) Elfective Q4 2021. gains (losses) on economic hedges of our US share-bosed compensation plans, which are reflected in revenue and related variability in shore-based compensation expense driven by changes in the for value of liabilities relating to our U.S. share based compensation plans have been reclassified from our Wealth Monogement segment to Corporate Support Comparative amounts have been reclassified to conform with this presentotion (2) Averoje amounts are calculated using methods intended to approximate the averoge of the daily balonces for the period. This includes average common equity used in the calculation of ROE. For further details, refer to the key performance and non-GAAP measures section (3) See Glossary for composition of this measure (4) LCR is the overage for the three months ended for each respective period and is calculated in accordance with the office of the Superintendent of Financial institutions (OSFI) Liquidity Adequacy Requirements (LAR) guidance. For further details, reler to the Liquidity and funding risk section (5) Beginning in Q1 2021. OSH requires Canodion Domestic Systemically important Bonks (DSi) to disclose the NSFR on a prospective basis. The NSFR is calculated in occordance with OSF's Liquidity Adequacy Requirements (LAR) guideline. For further details, refer to the Liquidity and funding risk section (6) Copitol rotios ore calculated using osfr's Capital Adequacy Requirements (CAR) guideline and the Leverage ratio is calculated using OSF's Leverage Requirements (UR) guideline (7) Represents year end spot bolonces (8) AUA includes $15 billion and $3 billion 2020 - $16 billion and s7 billion) of securitized residential mortgages and credit card loons, respectively. (9) Based on TSX closing market price ot period end. (16) Average amounts are calculated using month-end spot rates for the period. no not applicable nm not meaningful Management's Discussion and Analysis 14 Royal Bank of Conodo: Annual Report 2021 7.5% Overview and outlook Selected financial and other highlights Table 1 5 2021 49,693 $ (753) 3,891 25.924 20,631 16,050 $ 2020 47,181 5 4,351 3,683 24,758 14,389 11.4375 2021 vs. 2020 Increase (decrease 2.512 5.3% (5,104) (117.3) 208 5.6% 1,166 4.79 6,242 43.4% 4,613 40.3% $ $ 7,847 $ 2.626 889 440 4.187 61 16,050 $ 5,087 $ 2,154 831 536 2.776 53 11.437 $ 2,760 472 58 (96) 1,411 8 54.3% 21.9% 7.0% (17.9% 50.8% n.m. 40.3% $ 4,613 (Millions of Canadian dollars, excepe per share, number of and percentage amounts) Totol revenue Provision for credit losses (PCL) Insurance policyholder benefits, claims and acquisition expense (PBCAE) Non-interest expense Income before income taxes Net income Segments - net income Personal & Commercial Banking Wealth Management Insurance Investor & Treasury Services Copilul Markets Corporate Support Net income Selected information Earnings per share (EPS) - basic diluted Return on common equity (ROE) 12) Average common equity (2) Net interest margin (NIM) - on average earning assets.net PCL on loans as a % of average net loons and acceptances PCL on performing loons as a % of average net loans and acceptances PCL on Impaired loans os a % of overoge net loans and acceptances Gross impaired loans (GI) as a % of loons and acceptances Liquidity coverage ratio (LCR) (4) Net stable funding ratio (NSFR) (8) Capitol ratios and Leverage ratio (6) Common Equity Tier 1 (CETI) ratio Tier 1 capital ratio Total capital ratio Leverage ratio formation $ $ 11.08 $ 11.06 18.6% 84,850 $ 1.48% (0.10)% (0.20)% 0.10% 0.31% 123% 116% 7.84 $ 7.82 14.2% 78,800 $ 1.55% 0.63% 0.39% 0.24% 0.47% 145% n.o. 3.24 3.24 n.m. 6,050 n.m. n.m. n.m. n.m. n.m n.m. no 41.3% 41.4% 440 bps 7.7% (7) bps (73) bps (59) bps (14) bps (16) bps (2200) bps n.a 13.7% 14.9% 16.7% 4.9% 12.5% 13.5% 15.5% 4.8% n.m. n.m. n.m n.m. 120 bps 140 bps 120 bps 10 bps --- 59 im not sure how to do this and could use any kind of help! 
Step by Step Solution
There are 3 Steps involved in it
Step: 1

Get Instant Access to Expert-Tailored Solutions
See step-by-step solutions with expert insights and AI powered tools for academic success
Step: 2

Step: 3
Ace Your Homework with AI
Get the answers you need in no time with our AI-driven, step-by-step assistance
Get Started
Behavioral Finance Psychology Decision-Making and Markets
Authors: Lucy Ackert
1st edition
324661177, 978-0538752862, 538752866, 978-1111781675, 1111781672, 978-1133455486, 978-0324661170