

Answered step by step
Verified Expert Solution
Question
1 Approved Answer
Run the following code in R to generate the wide dataframe shown below: df - data. frame ( state = c ( Montana
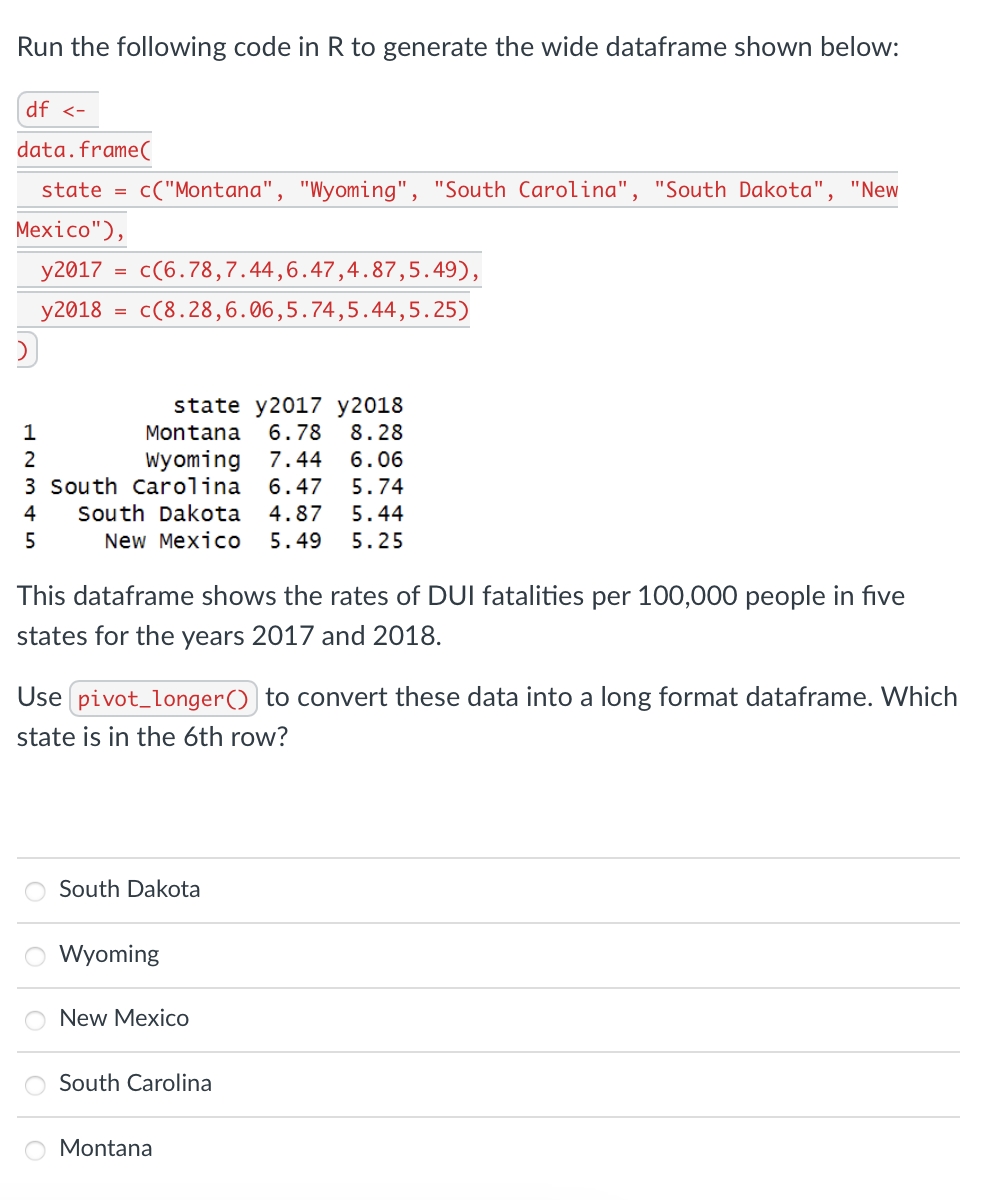
Run the following code in to generate the wide dataframe shown below:
df
data. frame
state cMontana "Wyoming", "South Carolina", "South Dakota", "New
Mexico"
y
y
state
Montana
Wyoming
South Carolina
South Dakota
New Mexico
This dataframe shows the rates of DUI fatalities per people in five
states for the years and
Use
to convert these data into a long format dataframe. Which
state is in the th row?
South Dakota
Wyoming
New Mexico
South Carolina
Montana
Step by Step Solution
There are 3 Steps involved in it
Step: 1

Get Instant Access to Expert-Tailored Solutions
See step-by-step solutions with expert insights and AI powered tools for academic success
Step: 2

Step: 3
Ace Your Homework with AI
Get the answers you need in no time with our AI-driven, step-by-step assistance
Get Started
Finance The Role Of Data Analytics In Manda Due Diligence
Authors: Ps Publishing
1st Edition
B0CR6SKTQG, 979-8873324675