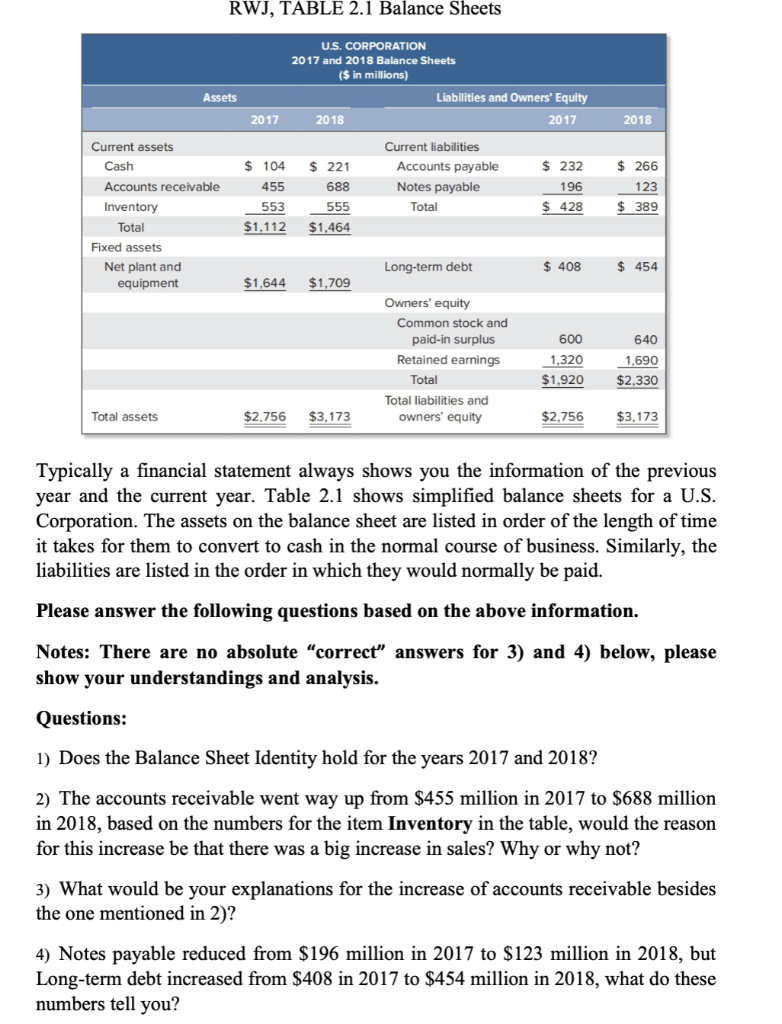
RWJ, TABLE 2.1 Balance Sheets U.S. CORPORATION 2017 and 2018 Balance Sheets ($ in millions) Assets Liabilities and Owners' Equity 2017 2018 2017 2018 Current assets Current liabilities Cash $ 104 $ 221 Accounts payable $ 232 $ 266 Accounts receivable 455 688 Notes payable 196 123 Inventory 553 555 Total $ 428 $ 389 Total $1,112 $1,464 Fixed assets Long-term debt $ 408 $ 454 Net plant and equipment $1,644 $1,709 Owners' equity Common stock and paid-in surplus Retained earnings 600 640 1,690 1,320 $1,920 Total $2.330 Total liabilities and owners' equity Total assets $2,756 $3,173 $2.756 $3,173 Typically a financial statement always shows you the information of the previous year and the current year. Table 2.1 shows simplified balance sheets for a U.S. Corporation. The assets on the balance sheet are listed in order of the length of time it takes for them to convert to cash in the normal course of business. Similarly, the liabilities are listed in the order in which they would normally be paid. Please answer the following questions based on the above information. Notes: There are no absolute "correct" answers for 3) and 4) below, please show your understandings and analysis. Questions: 1) Does the Balance Sheet Identity hold for the years 2017 and 2018? 2) The accounts receivable went way up from $455 million in 2017 to $688 million in 2018, based on the numbers for the item Inventory in the table, would the reason for this increase be that there was a big increase in sales? Why or why not? 3) What would be your explanations for the increase of accounts receivable besides the one mentioned in 2)? 4) Notes payable reduced from $196 million in 2017 to $123 million in 2018, but Long-term debt increased from $408 in 2017 to $454 million in 2018, what do these numbers tell you? RWJ, TABLE 2.1 Balance Sheets U.S. CORPORATION 2017 and 2018 Balance Sheets ($ in millions) Assets Liabilities and Owners' Equity 2017 2018 2017 2018 Current assets Current liabilities Cash $ 104 $ 221 Accounts payable $ 232 $ 266 Accounts receivable 455 688 Notes payable 196 123 Inventory 553 555 Total $ 428 $ 389 Total $1,112 $1,464 Fixed assets Long-term debt $ 408 $ 454 Net plant and equipment $1,644 $1,709 Owners' equity Common stock and paid-in surplus Retained earnings 600 640 1,690 1,320 $1,920 Total $2.330 Total liabilities and owners' equity Total assets $2,756 $3,173 $2.756 $3,173 Typically a financial statement always shows you the information of the previous year and the current year. Table 2.1 shows simplified balance sheets for a U.S. Corporation. The assets on the balance sheet are listed in order of the length of time it takes for them to convert to cash in the normal course of business. Similarly, the liabilities are listed in the order in which they would normally be paid. Please answer the following questions based on the above information. Notes: There are no absolute "correct" answers for 3) and 4) below, please show your understandings and analysis. Questions: 1) Does the Balance Sheet Identity hold for the years 2017 and 2018? 2) The accounts receivable went way up from $455 million in 2017 to $688 million in 2018, based on the numbers for the item Inventory in the table, would the reason for this increase be that there was a big increase in sales? Why or why not? 3) What would be your explanations for the increase of accounts receivable besides the one mentioned in 2)? 4) Notes payable reduced from $196 million in 2017 to $123 million in 2018, but Long-term debt increased from $408 in 2017 to $454 million in 2018, what do these numbers tell you