

Answered step by step
Verified Expert Solution
Question
1 Approved Answer
s, lmagime a SAR image of a smooth land surtace whose rcs does not chenge much within large areas. The image has been processed to
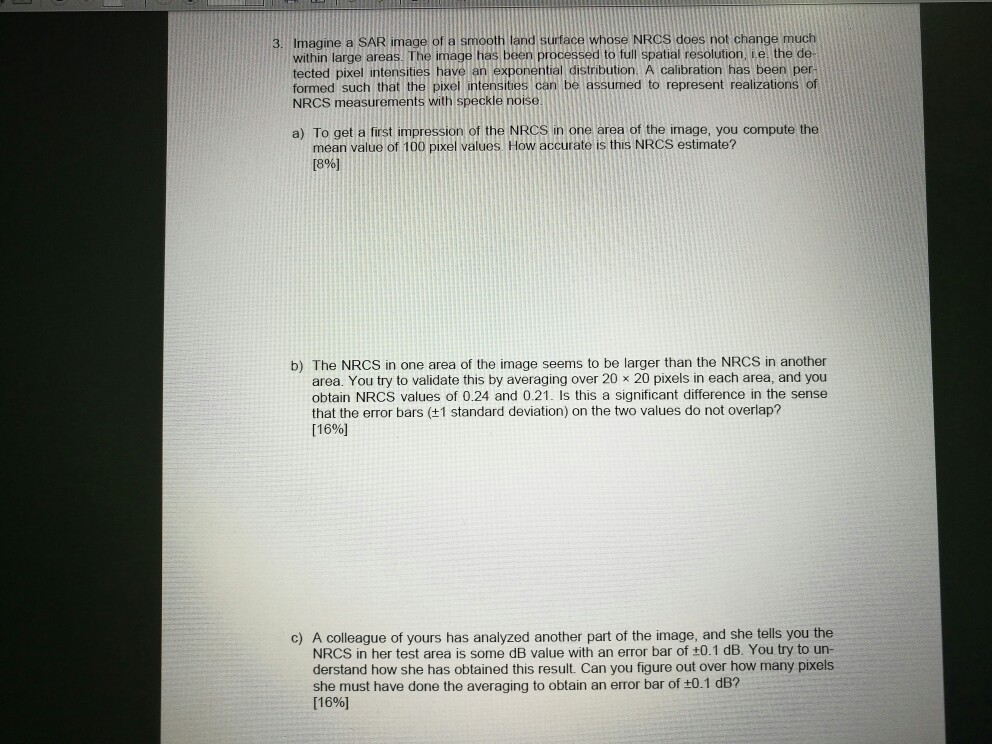
s, lmagime a SAR image of a smooth land surtace whose rcs does not chenge much within large areas. The image has been processed to full spatial resolution, ie the de- tected pixel intensities have an exponential distribution. A calibration has been per- formed such that the pixel intensities can be assumed to represent realizations of NRCS measurements with speckle noise. a) To get a first impression of the NRCS in one area of the image, you compute the mean value of 100 pixel values. How accurate is this NRCS estimate? [8%) b) The NRCS in one area of the image seems to be larger than the NRCS in another area, You try to validate this by averaging over 20 20 pixels in each area, and you obtain NRCS values of 0.24 and 0.21. Is this a significant difference in the sense that the error bars (1 standard deviation) on the two values do not overlap? [16%) c) A colleague of yours has analyzed another part of the image, and she tells you the NRCS in her test area is some dB value with an error bar of 0.1 dB. You try to un- derstand how she has obtained this result. Can you figure out over how many pixels she must have done the averaging to obtain an error bar of 0.1 dB? [16%1 s, lmagime a SAR image of a smooth land surtace whose rcs does not chenge much within large areas. The image has been processed to full spatial resolution, ie the de- tected pixel intensities have an exponential distribution. A calibration has been per- formed such that the pixel intensities can be assumed to represent realizations of NRCS measurements with speckle noise. a) To get a first impression of the NRCS in one area of the image, you compute the mean value of 100 pixel values. How accurate is this NRCS estimate? [8%) b) The NRCS in one area of the image seems to be larger than the NRCS in another area, You try to validate this by averaging over 20 20 pixels in each area, and you obtain NRCS values of 0.24 and 0.21. Is this a significant difference in the sense that the error bars (1 standard deviation) on the two values do not overlap? [16%) c) A colleague of yours has analyzed another part of the image, and she tells you the NRCS in her test area is some dB value with an error bar of 0.1 dB. You try to un- derstand how she has obtained this result. Can you figure out over how many pixels she must have done the averaging to obtain an error bar of 0.1 dB? [16%1
Step by Step Solution
There are 3 Steps involved in it
Step: 1

Get Instant Access to Expert-Tailored Solutions
See step-by-step solutions with expert insights and AI powered tools for academic success
Step: 2

Step: 3
Ace Your Homework with AI
Get the answers you need in no time with our AI-driven, step-by-step assistance
Get Started
Database Systems For Advanced Applications Dasfaa 2022 International Workshops Bdms Bdqm Gdma Iwbt Maqtds And Pmbd Virtual Event April 11 14 2022 Proceedings Lncs 13248
Authors: Uday Kiran Rage ,Vikram Goyal ,P. Krishna Reddy
1st Edition
3031112164, 978-3031112164