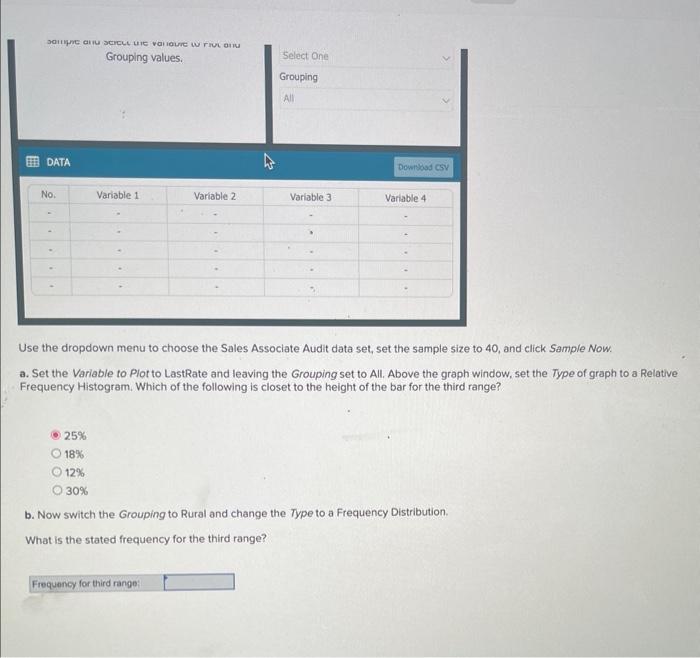
Question: sainge ails sercut we vaibue wu riun ami. Grouping values. Select one Grouping All DATA Use the dropdown menu to choose the Sales Associate Audit


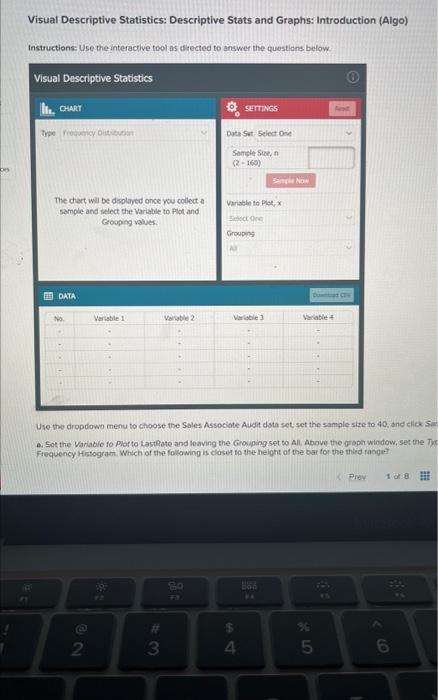
sainge ails sercut we vaibue wu riun ami. Grouping values. Select one Grouping All DATA Use the dropdown menu to choose the Sales Associate Audit data set, set the sample size to 40, and click Sample Now. a. Set the Variable to Plot to LastRate and leaving the Grouping set to All. Above the graph window, set the Type of graph to a Relative Frequency Histogram. Which of the following is closet to the height of the bar for the third range? 25%18%12%30% b. Now switch the Grouping to Rural and change the Type to a Frequency Distribution. What is the stated frequency for the third range? Visual Descriptive Statistics: Descriptive Stats and Graphs: Introduction (Algo) Instructions: Use the interactive tool as diected to answer the quostions below: Visual Descriptive Statistics Dath Set select One Sample Sice, n (2+169) The chart wil be depleyed once you collect a Variath to Plot, x sample and select the variable to plot and Broceping values. Feited ore Groupng DNTA Use the dropdowa menu to choose the Sales Associate Audit data set, set the sample size to 40 , and click Si. a. Sot the Variabio to Plor to LastPate and leaving the Grouping set to All. Above the graph window, set the Ty Fiequency Histogramt. Which of the following is claser to the height of the bar for the third ranget sainge ails sercut we vaibue wu riun ami. Grouping values. Select one Grouping All DATA Use the dropdown menu to choose the Sales Associate Audit data set, set the sample size to 40, and click Sample Now. a. Set the Variable to Plot to LastRate and leaving the Grouping set to All. Above the graph window, set the Type of graph to a Relative Frequency Histogram. Which of the following is closet to the height of the bar for the third range? 25%18%12%30% b. Now switch the Grouping to Rural and change the Type to a Frequency Distribution. What is the stated frequency for the third range? Visual Descriptive Statistics: Descriptive Stats and Graphs: Introduction (Algo) Instructions: Use the interactive tool as diected to answer the quostions below: Visual Descriptive Statistics Dath Set select One Sample Sice, n (2+169) The chart wil be depleyed once you collect a Variath to Plot, x sample and select the variable to plot and Broceping values. Feited ore Groupng DNTA Use the dropdowa menu to choose the Sales Associate Audit data set, set the sample size to 40 , and click Si. a. Sot the Variabio to Plor to LastPate and leaving the Grouping set to All. Above the graph window, set the Ty Fiequency Histogramt. Which of the following is claser to the height of the bar for the third ranget
Step by Step Solution
There are 3 Steps involved in it

Get step-by-step solutions from verified subject matter experts


