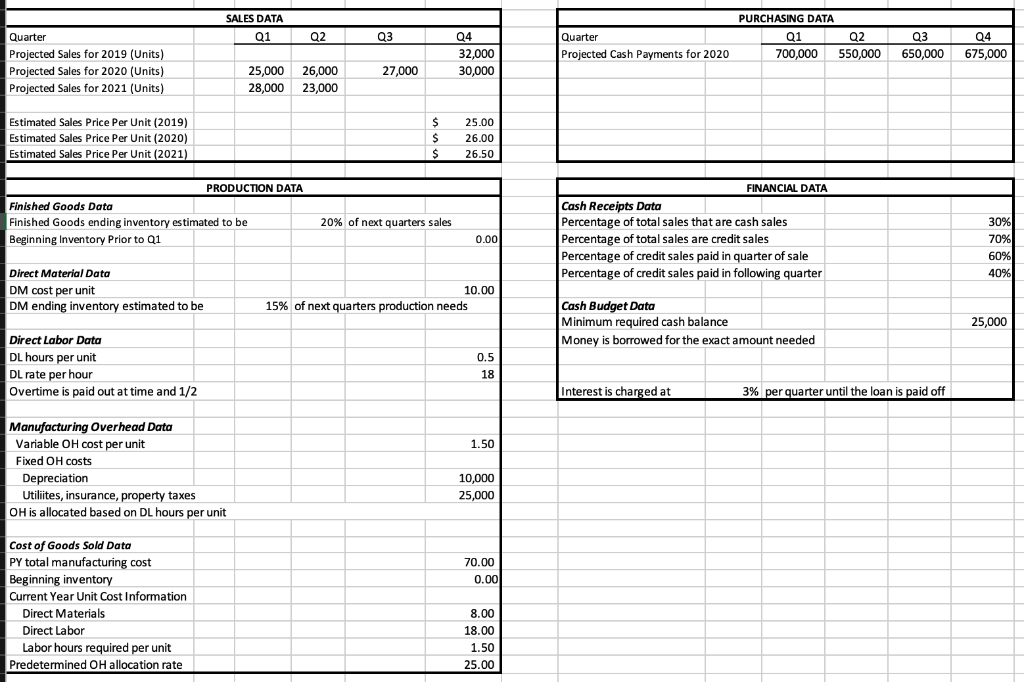


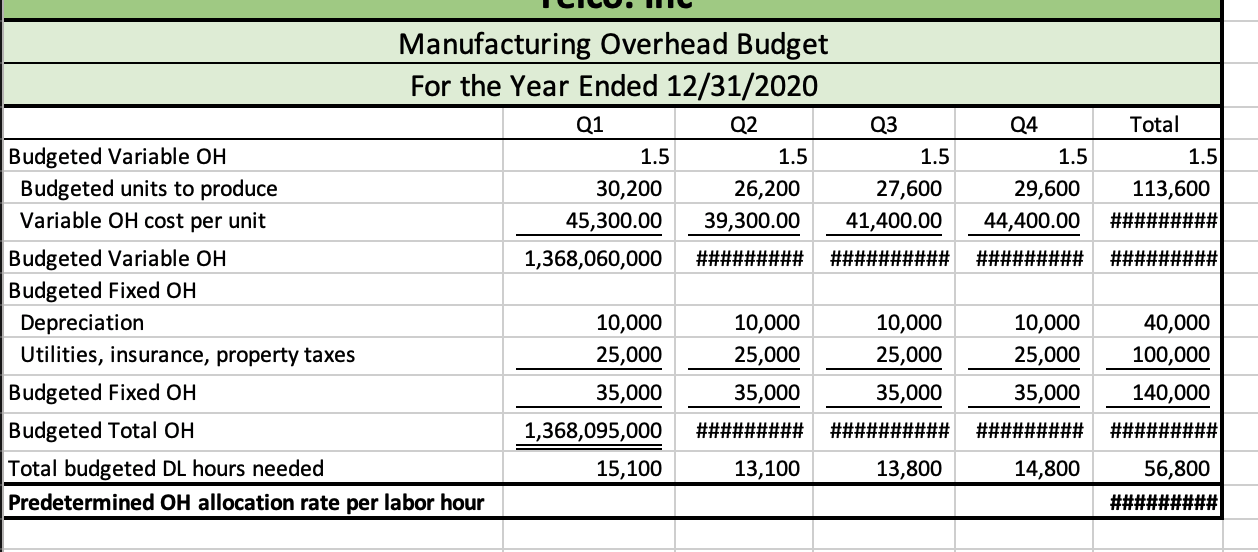
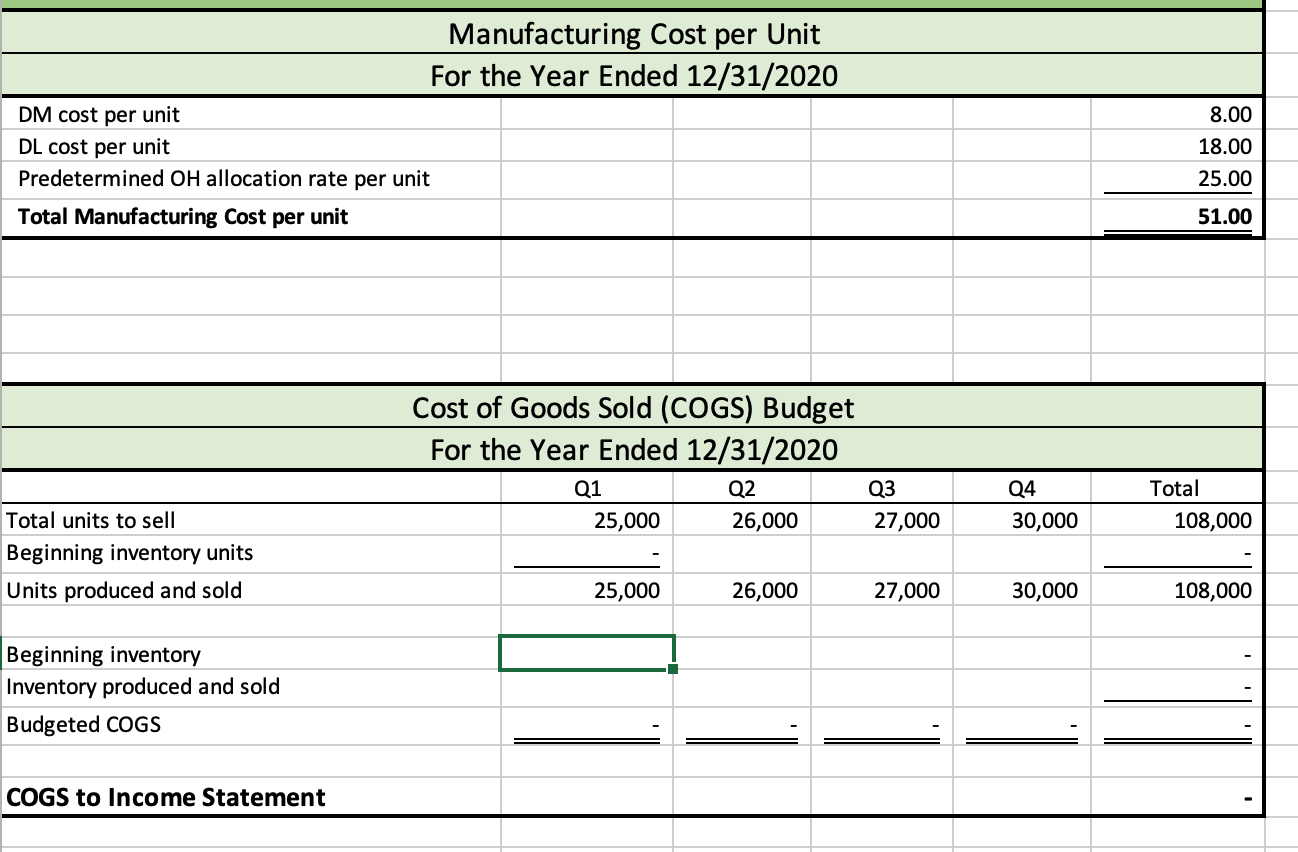
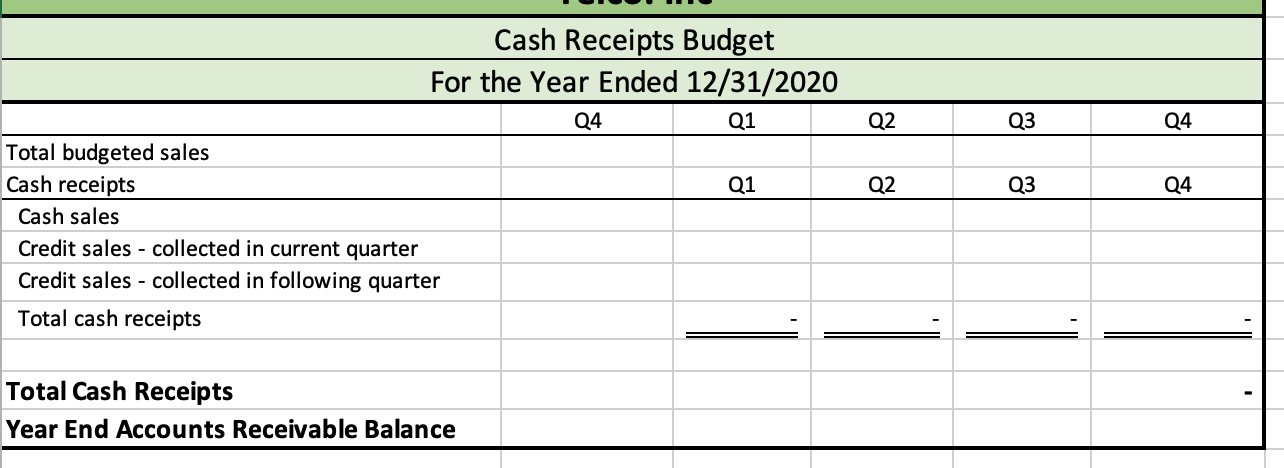
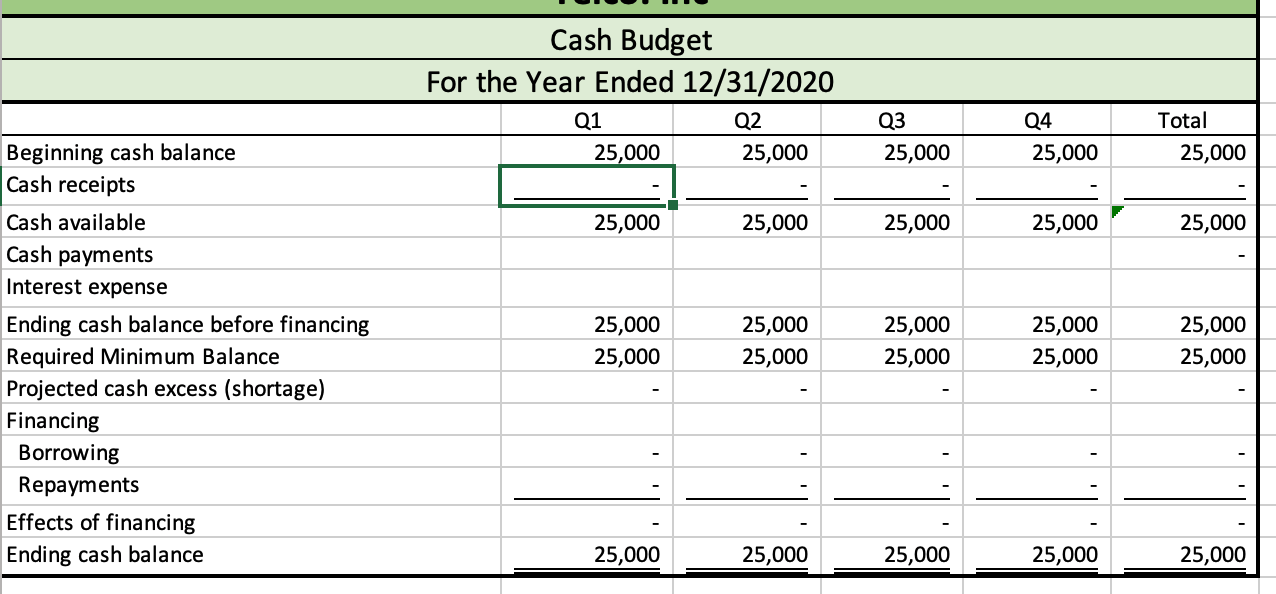
SALES DATA 01 02 03 04 32,000 30,000 Quarter Projected Cash Payments for 2020 PURCHASING DATA Q1 700,000 Q2 550,000 Q3 650,000 Quarter Projected Sales for 2019 (Units) Projected Sales for 2020 (Units) Projected Sales for 2021 (Units) Q4 675,000 27,000 25,000 28,000 26,000 23,000 Estimated Sales Price Per Unit (2019) Estimated Sales Price Per Unit (2020) Estimated Sales Price Per Unit (2021) $ $ $ 25.00 26.00 26.50 PRODUCTION DATA Finished Goods Data Finished Goods ending inventory estimated to be Beginning Inventory Prior to Q1 20% of next quarters sales FINANCIAL DATA Cash Receipts Data Percentage of total sales that are cash sales Percentage of total sales are credit sales Percentage of credit sales paid in quarter of sale Percentage of credit sales paid in following quarter 0.00 30% 70% 60% 40% Direct Material Data DM cost per unit DM ending inventory estimated to be 10.00 15% of next quarters production needs Cash Budget Data Minimum required cash balance Money is borrowed for the exact amount needed 25,000 Direct Labor Data DL hours per unit DL rate per hour Overtime is paid out at time and 1/2 Interest is charged at 3% per quarter until the loan is paid off 1.50 Manufacturing Overhead Data Variable OH cost per unit Fixed OH costs Depreciation Utiliites, insurance, property taxes OH is allocated based on DL hours per unit 10,000 25,000 70.00 0.00 Cost of Goods Sold Data PY total manufacturing cost Beginning inventory Current Year Unit Cost Information Direct Materials Direct Labor Labor hours required per unit Predetermined OH allocation rate 8.00 18.00 1.50 25.00 Sales Budget For the Year Ended 12/31/2020 Q1 Q2 Q3 25,000 26,000 Budgeted units sold Sales price per unit Total sales Q4 30,000 26 780,000 Total 108,000 26 2,808,000 27,000 26 702,000 26 26 650,000 676,000 Production Budget For the Year Ended 12/31/2020 Q1 Q2 23,000 Year 2 Q1 28,000 4,600 Budgeted units to sell Ending inventory Total needed Beginning inventory Budgeted units to produce 25,000 5,200 30,200 Q3 27,000 6,000 33,000 5,400 26,000 5,400 31,400 5,200 Q4 30,000 5,600 35,600 6,000 29,600 Total 108,000 5,600 113,600 32,600 5,600 27,000 30,200 26,200 27,600 113,600 Q3 Q1 27,000 10 10 Budgeted units to produce DM cost per unit DM needed for production Ending DM inventory Total DM needed Beginning DM inventory Budgeted purchases of DM Direct Materials Budget For the Year Ended 12/31/2020 Q1 Q2 30,200 26,200 10 302,000 262,000 39,300 41,400 341,300 303,400 39,300 341,300 264,100 270,000 27,600 10 276,000 44,400 320,400 41,400 279,000 Q4 29,600 10 296,000 40,500 336,500 44,400 292,100 Total 113,600 10 1,136,000 40,500 1,176,500 1,176,500 03 Direct Labor Budget For the Year Ended 12/31/2020 Q1 Q2 30,200 26,200 0.5 0.5 15,100 13,100 18 18 271,800 235,800 27,600 0.5 Total 113,600 0.5 Budgeted units to produce DL hours per unit DL needed for production DL cost per hour Budgeted DL cost 04 29,600 0.5 14,800 18 266,400 13,800 18 248,400 56,800 18 1,022,400 IL . Q4 1.5 29,600 44,400.00 Total 1.5 113,600 ######### ######### ######### Manufacturing Overhead Budget For the Year Ended 12/31/2020 Q1 Q2 Q3 Budgeted Variable OH 1.5 1.5 1.5 Budgeted units to produce 30,200 26,200 27,600 Variable OH cost per unit 45,300.00 39,300.00 41,400.00 Budgeted Variable OH 1,368,060,000 ######### ########## Budgeted Fixed OH Depreciation 10,000 10,000 10,000 Utilities, insurance, property taxes 25,000 25,000 25,000 Budgeted Fixed OH 35,000 35,000 35,000 Budgeted Total OH 1,368,095,000 ######### ########## Total budgeted DL hours needed 15,100 13,100 13,800 Predetermined OH allocation rate per labor hour 10,000 25,000 40,000 100,000 140,000 35,000 ######### ######### 14,800 56,800 ######### Manufacturing Cost per Unit For the Year Ended 12/31/2020 DM cost per unit DL cost per unit Predetermined OH allocation rate per unit Total Manufacturing Cost per unit 8.00 18.00 25.00 51.00 Cost of Goods Sold (COGS) Budget For the Year Ended 12/31/2020 Q1 Q2 Q3 25,000 26,000 27,000 04 Total 108,000 30,000 Total units to sell Beginning inventory units Units produced and sold 25,000 26,000 27,000 30,000 108,000 Beginning inventory Inventory produced and sold Budgeted COGS COGS to Income Statement Q2 Q3 Q4 Cash Receipts Budget For the Year Ended 12/31/2020 24 Q1 Total budgeted sales Cash receipts Q1 Cash sales Credit sales - collected in current quarter Credit sales - collected in following quarter Total cash receipts Q2 Q3 Q4 Total Cash Receipts Year End Accounts Receivable Balance Cash Budget For the Year Ended 12/31/2020 Q1 Q2 25,000 25,000 Q3 25,000 Q4 25,000 Total 25,000 25,000 25,000 25,000 25,000 25,000 Beginning cash balance Cash receipts Cash available Cash payments Interest expense Ending cash balance before financing Required Minimum Balance Projected cash excess (shortage) Financing Borrowing Repayments Effects of financing Ending cash balance 25,000 25,000 25,000 25,000 25,000 25,000 25,000 25,000 25,000 25,000 25,000 25,000 25,000 25,000 25,000 SALES DATA 01 02 03 04 32,000 30,000 Quarter Projected Cash Payments for 2020 PURCHASING DATA Q1 700,000 Q2 550,000 Q3 650,000 Quarter Projected Sales for 2019 (Units) Projected Sales for 2020 (Units) Projected Sales for 2021 (Units) Q4 675,000 27,000 25,000 28,000 26,000 23,000 Estimated Sales Price Per Unit (2019) Estimated Sales Price Per Unit (2020) Estimated Sales Price Per Unit (2021) $ $ $ 25.00 26.00 26.50 PRODUCTION DATA Finished Goods Data Finished Goods ending inventory estimated to be Beginning Inventory Prior to Q1 20% of next quarters sales FINANCIAL DATA Cash Receipts Data Percentage of total sales that are cash sales Percentage of total sales are credit sales Percentage of credit sales paid in quarter of sale Percentage of credit sales paid in following quarter 0.00 30% 70% 60% 40% Direct Material Data DM cost per unit DM ending inventory estimated to be 10.00 15% of next quarters production needs Cash Budget Data Minimum required cash balance Money is borrowed for the exact amount needed 25,000 Direct Labor Data DL hours per unit DL rate per hour Overtime is paid out at time and 1/2 Interest is charged at 3% per quarter until the loan is paid off 1.50 Manufacturing Overhead Data Variable OH cost per unit Fixed OH costs Depreciation Utiliites, insurance, property taxes OH is allocated based on DL hours per unit 10,000 25,000 70.00 0.00 Cost of Goods Sold Data PY total manufacturing cost Beginning inventory Current Year Unit Cost Information Direct Materials Direct Labor Labor hours required per unit Predetermined OH allocation rate 8.00 18.00 1.50 25.00 Sales Budget For the Year Ended 12/31/2020 Q1 Q2 Q3 25,000 26,000 Budgeted units sold Sales price per unit Total sales Q4 30,000 26 780,000 Total 108,000 26 2,808,000 27,000 26 702,000 26 26 650,000 676,000 Production Budget For the Year Ended 12/31/2020 Q1 Q2 23,000 Year 2 Q1 28,000 4,600 Budgeted units to sell Ending inventory Total needed Beginning inventory Budgeted units to produce 25,000 5,200 30,200 Q3 27,000 6,000 33,000 5,400 26,000 5,400 31,400 5,200 Q4 30,000 5,600 35,600 6,000 29,600 Total 108,000 5,600 113,600 32,600 5,600 27,000 30,200 26,200 27,600 113,600 Q3 Q1 27,000 10 10 Budgeted units to produce DM cost per unit DM needed for production Ending DM inventory Total DM needed Beginning DM inventory Budgeted purchases of DM Direct Materials Budget For the Year Ended 12/31/2020 Q1 Q2 30,200 26,200 10 302,000 262,000 39,300 41,400 341,300 303,400 39,300 341,300 264,100 270,000 27,600 10 276,000 44,400 320,400 41,400 279,000 Q4 29,600 10 296,000 40,500 336,500 44,400 292,100 Total 113,600 10 1,136,000 40,500 1,176,500 1,176,500 03 Direct Labor Budget For the Year Ended 12/31/2020 Q1 Q2 30,200 26,200 0.5 0.5 15,100 13,100 18 18 271,800 235,800 27,600 0.5 Total 113,600 0.5 Budgeted units to produce DL hours per unit DL needed for production DL cost per hour Budgeted DL cost 04 29,600 0.5 14,800 18 266,400 13,800 18 248,400 56,800 18 1,022,400 IL . Q4 1.5 29,600 44,400.00 Total 1.5 113,600 ######### ######### ######### Manufacturing Overhead Budget For the Year Ended 12/31/2020 Q1 Q2 Q3 Budgeted Variable OH 1.5 1.5 1.5 Budgeted units to produce 30,200 26,200 27,600 Variable OH cost per unit 45,300.00 39,300.00 41,400.00 Budgeted Variable OH 1,368,060,000 ######### ########## Budgeted Fixed OH Depreciation 10,000 10,000 10,000 Utilities, insurance, property taxes 25,000 25,000 25,000 Budgeted Fixed OH 35,000 35,000 35,000 Budgeted Total OH 1,368,095,000 ######### ########## Total budgeted DL hours needed 15,100 13,100 13,800 Predetermined OH allocation rate per labor hour 10,000 25,000 40,000 100,000 140,000 35,000 ######### ######### 14,800 56,800 ######### Manufacturing Cost per Unit For the Year Ended 12/31/2020 DM cost per unit DL cost per unit Predetermined OH allocation rate per unit Total Manufacturing Cost per unit 8.00 18.00 25.00 51.00 Cost of Goods Sold (COGS) Budget For the Year Ended 12/31/2020 Q1 Q2 Q3 25,000 26,000 27,000 04 Total 108,000 30,000 Total units to sell Beginning inventory units Units produced and sold 25,000 26,000 27,000 30,000 108,000 Beginning inventory Inventory produced and sold Budgeted COGS COGS to Income Statement Q2 Q3 Q4 Cash Receipts Budget For the Year Ended 12/31/2020 24 Q1 Total budgeted sales Cash receipts Q1 Cash sales Credit sales - collected in current quarter Credit sales - collected in following quarter Total cash receipts Q2 Q3 Q4 Total Cash Receipts Year End Accounts Receivable Balance Cash Budget For the Year Ended 12/31/2020 Q1 Q2 25,000 25,000 Q3 25,000 Q4 25,000 Total 25,000 25,000 25,000 25,000 25,000 25,000 Beginning cash balance Cash receipts Cash available Cash payments Interest expense Ending cash balance before financing Required Minimum Balance Projected cash excess (shortage) Financing Borrowing Repayments Effects of financing Ending cash balance 25,000 25,000 25,000 25,000 25,000 25,000 25,000 25,000 25,000 25,000 25,000 25,000 25,000 25,000 25,000


