

Answered step by step
Verified Expert Solution
Question
1 Approved Answer
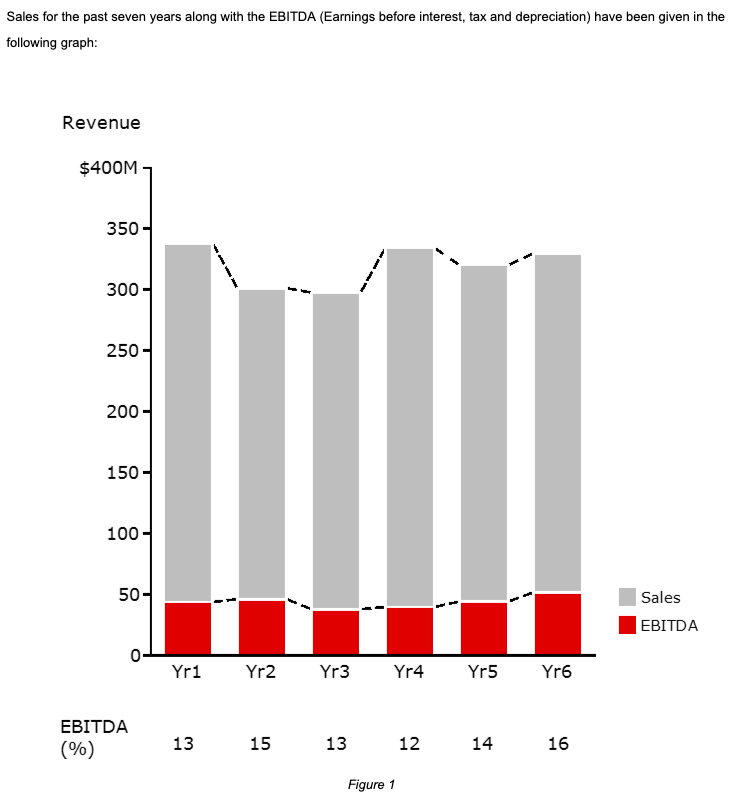
Sales for the past seven years along with the EBITDA (Earnings before interest, tax and depreciation) have been given in the following graph: Revenue $400M
Step by Step Solution
There are 3 Steps involved in it
Step: 1

Get Instant Access to Expert-Tailored Solutions
See step-by-step solutions with expert insights and AI powered tools for academic success
Step: 2

Step: 3
Ace Your Homework with AI
Get the answers you need in no time with our AI-driven, step-by-step assistance
Get Started
Financial Dimensions Of Marketing Decisions
Authors: David W. Stewart
1st Edition
3030155641,303015565X