Answered step by step
Verified Expert Solution
Question
1 Approved Answer
SALES PIPELINE PERFORMANCE & INSIGHTS Date Range Year to Date N vs N-1 Executive Operational Performance Executive tab Enables businesses to evaluate performance, identify


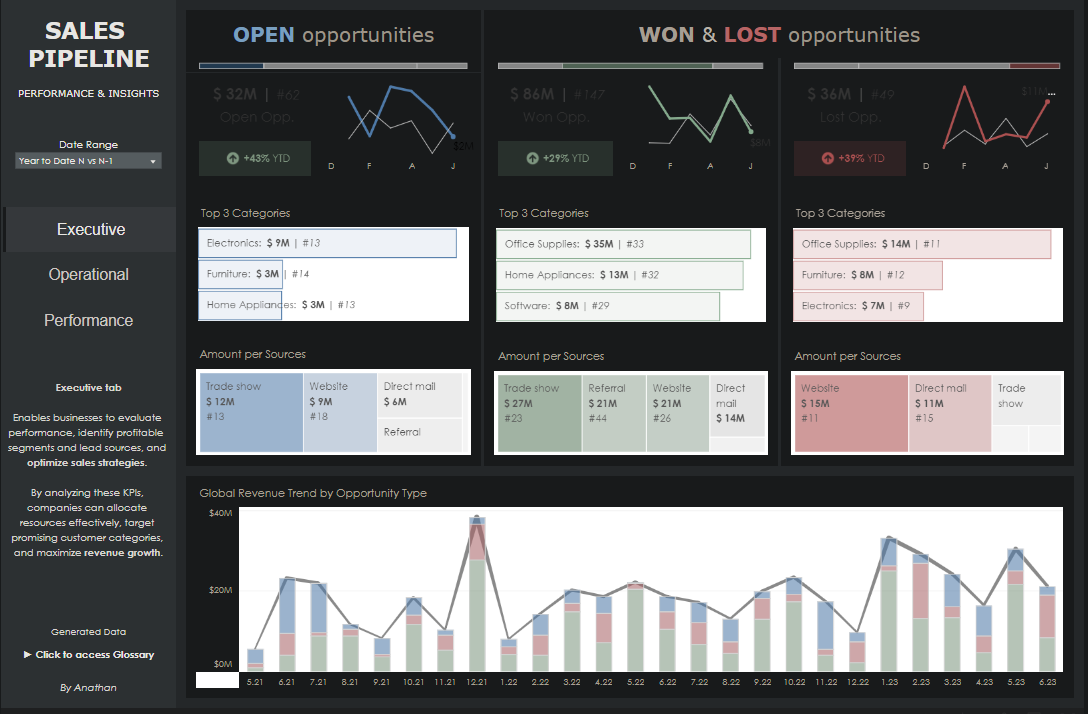
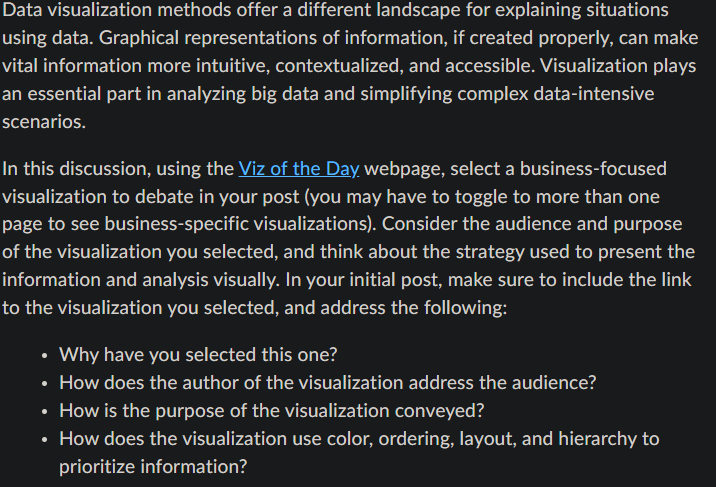
SALES PIPELINE PERFORMANCE & INSIGHTS Date Range Year to Date N vs N-1 Executive Operational Performance Executive tab Enables businesses to evaluate performance, identify profitable segments and lead sources, and optimize sales strategies. By analyzing these KPIs, companies can allocate resources effectively, target promising customer categories, and maximize revenue growth. Generated Data Click to access Glossary By Anathan $ 32M | #62 Open Opp. OPEN opportunities Top 3 Categories +43% YTD Electronics: $ 9M | #13 Furniture: $ 3M #14 Home Appliances: $ 3M | #13 Amount per Sources Trade show $ 12M #13 $20M $OM D Website $ 9M # 18 Direct mail $ 6M Global Revenue Trend by Opportunity Type $40M Referral $2M J $ 86M | #147 Won Opp. +29% YTD Top 3 Categories Amount per Sources Trade show $ 27M #23 D Office Supplies: $35M | #33 Home Appliances: $ 13M | #32 Software: $ 8M | #29 Referral $ 21M #44 WON & LOST opportunities y F A Website $21M #26 Direct mail $14M $8M J $36M | #49 Lost Opp. +39% YTD Furniture: $ 8M | #12 Top 3 Categories Office Supplies: $14M | #11 Electronics: $7M | #9 Amount per Sources Website $15M #11 Axi 5.21 6.21 7.21 8.21 9.21 10.21 11.21 12.21 1.22 2.22 3.22 4.22 5.22 6.22 7.22 8.22 9.22 10.22 11.22 12.22 1.23 D F A Direct mail $11M # 15 2.23 3.23 4.23 Trade show 5.23 6.23 Data visualization methods offer a different landscape for explaining situations using data. Graphical representations of information, if created properly, can make vital information more intuitive, contextualized, and accessible. Visualization plays an essential part in analyzing big data and simplifying complex data-intensive scenarios. In this discussion, using the Viz of the Day webpage, select a business-focused visualization to debate in your post (you may have to toggle to more than one page to see business-specific visualizations). Consider the audience and purpose of the visualization you selected, and think about the strategy used to present the information and analysis visually. In your initial post, make sure to include the link to the visualization you selected, and address the following: Why have you selected this one? How does the author of the visualization address the audience? How is the purpose of the visualization conveyed? How does the visualization use color, ordering, layout, and hierarchy to prioritize information?
Step by Step Solution
There are 3 Steps involved in it
Step: 1

Get Instant Access to Expert-Tailored Solutions
See step-by-step solutions with expert insights and AI powered tools for academic success
Step: 2

Step: 3

Ace Your Homework with AI
Get the answers you need in no time with our AI-driven, step-by-step assistance
Get Started


