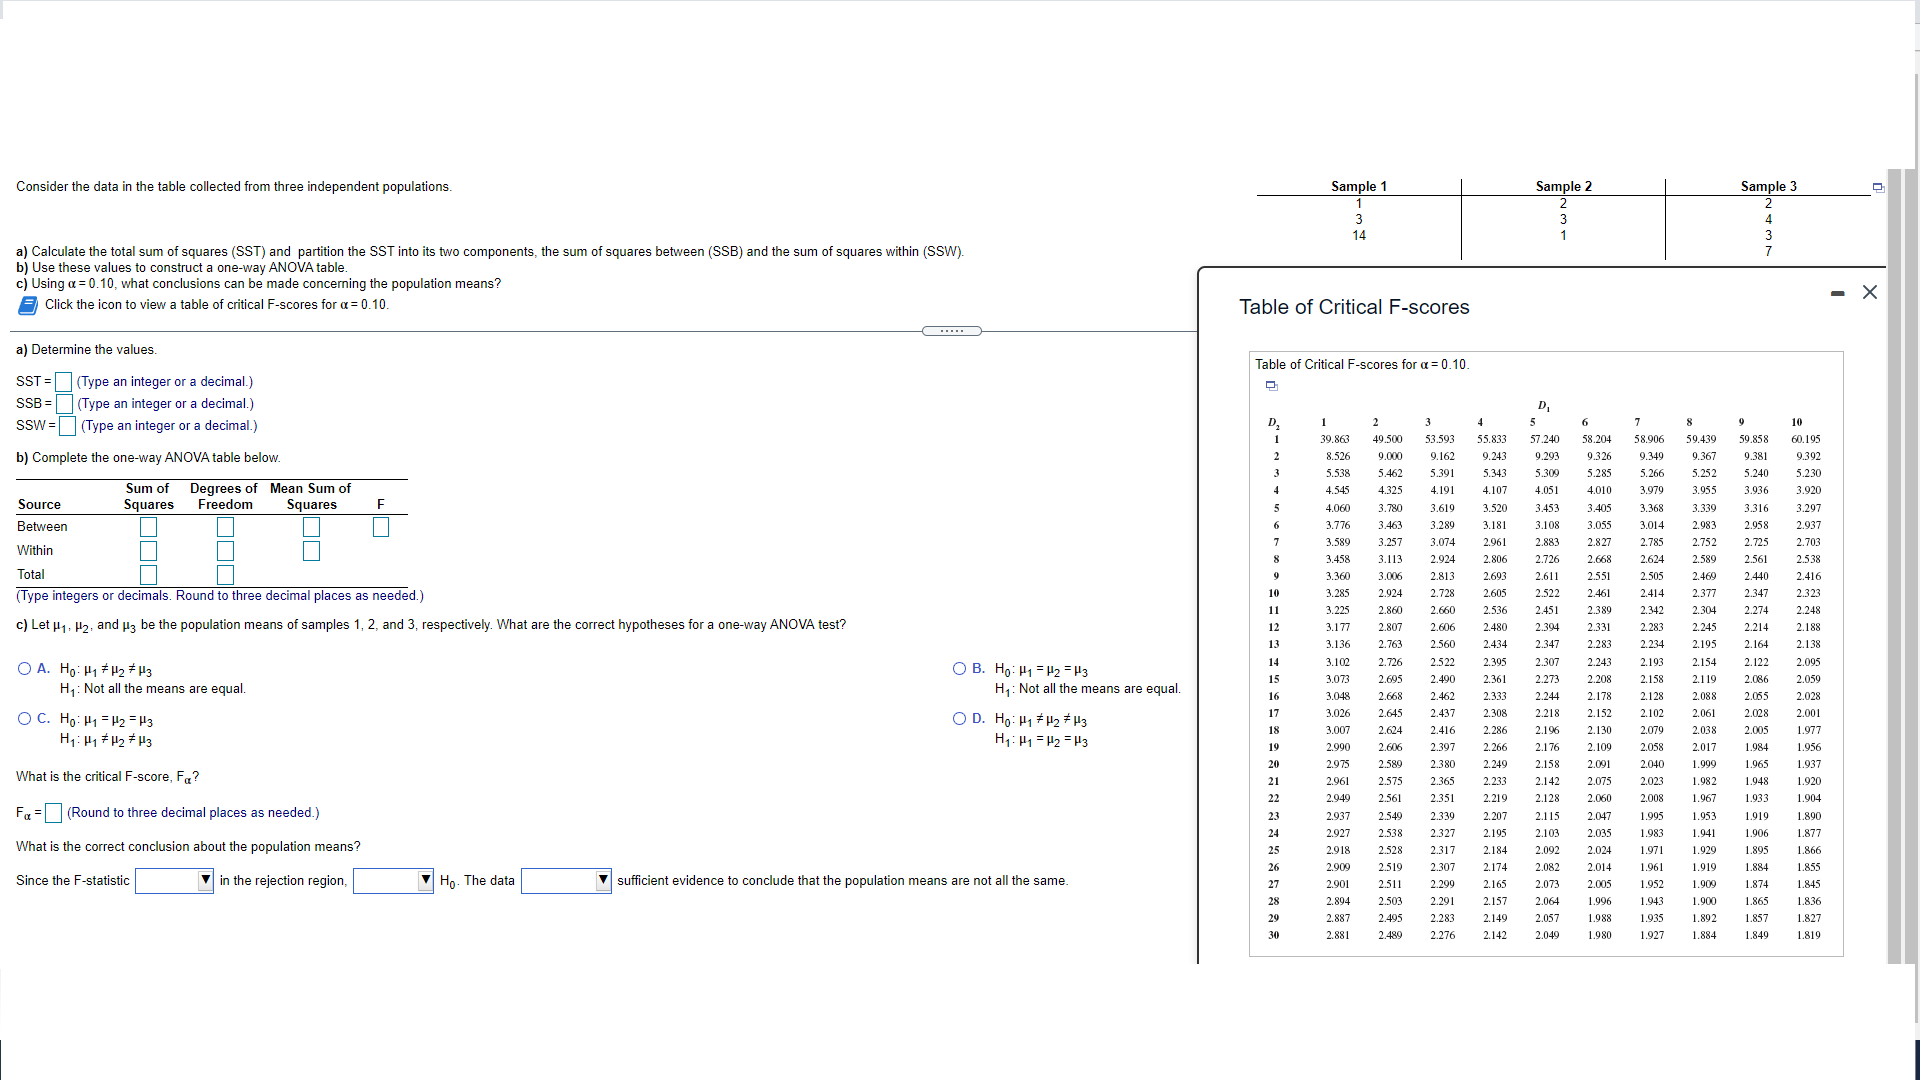
Sample 3 Sample 1 Sample 2 1 2 WAN. Consider the data in the table collected from three independent populations. 3 14 a) Calculate the total sum of squares (SST) and partition the SST into its two components, the sum of squares between (SSB) and the sum of squares within (SSW). X b) Use these values to construct a one-way ANOVA table. c) Using a = 0.10, what conclusions can be made concerning the population means? Table of Critical F-scores Click the icon to view a table of critical F-scores for a = 0.10. Table of Critical F-scores for a = 0.10. a) Determine the values. D SST = (Type an integer or a decimal.) 8 10 2 5 6 SSB = (Type an integer or a decimal.) 49.500 53.593 55.833 7.240 58.204 58.906 59.439 59.85 60.19 39.863 0. 243 0 29 3.326 310 136 9.381 9.392 SSW =(Type an integer or a decimal.) 8.52 9.000 0.16 5.391 5.343 5.285 5.26 5.252 5.240 5.230 5,538 5.462 4.051 4.010 3 070 3 05 3.936 3.920 b) Complete the one-way ANOVA table below. 1 54 4.325 19 4.107 3453 3.405 3.368 3.33 3.316 3.297 4.060 3.780 3.619 3.520 Degrees of Mean Sum of 2.983 2.958 2.937 Sum of 3.776 3.463 3.280 3.181 3.108 3.055 Source Freedom Squares 2.827 2.78 2.75 2.725 2.70 squares 3.58 3.257 3.074 2961 2.624 2.561 Between 3.113 2.924 2.806 2.668 2.589 2.538 2.120 3.458 2.505 2.46 2.440 2.416 3.360 8.006 2.813 2.693 2.611 2.551 Within 2.371 2.347 2.323 3.28 2.924 2128 2.602 2.522 2.461 2.414 2.536 2.451 .389 2.342 2.30 2.274 2.248 Total 3.225 2.860 2.331 2.283 2.240 2.214 2.188 (Type integers or decimals. Round to three decimal places as needed.) 3.177 2.807 2.606 2.480 2.394 283 2.234 2.195 2.164 2.138 3.136 2.763 2.560 2.434 2.347 c) Let H1, H2, and u3 be the population means of samples 1, 2, and 3, respectively. What are the correct hypotheses for a one-way ANOVA test? 2.24 2.193 2.154 2.122 2.095 3.102 2.726 2.52. 2.395 2.30 2.1 19 2.086 2.05 O B. Ho: H1 = H2 = H3 2.695 2.490 2.361 2.27. 3.073 2.208 2.158 2.244 2.178 2.128 2.088 2.065 2.028 OA. Ho: H1 # H2 # H3 Hy: Not all the means are equal. 3.048 2.668 2.462 2.333 2.308 2.218 2.15 2.102 2.061 2.028 2.00 3.026 2.645 2.437 H1: Not all the means are equal. 2.005 1.977 OD. HO: H1 # H2 # H3 3.007 2.624 2.416 2.286 2.196 2.13 2.079 2.038 , 10 2.058 2.017 .984 1.956 H1 : 141 = H2 = H3 2.990 2.606 2.397 2.266 2.176 O C. Ho: H1 = H2 = H3 2.091 2.040 1.999 1.965 1.937 2.589 2.380 2.249 .158 2.975 H1: 141 # 12 # H3 202 982 948 1.920 2.961 2.575 2.365 2.233 2.142 2.075 1.933 1.904 2.949 2.561 35 2.219 2.128 2.060 2.008 .967 What is the critical F-score, Fa? .919 1.890 2.937 2.549 2.339 2.207 2.115 2.047 1.995 953 2.103 2.035 1.983 041 1.906 1.877 2.92 2.538 2.327 2.195 1.866 Fa =(Round to three decimal places as needed.) 02 1.895 2.918 2.528 2.317 2.184 2.092 .024 1.855 2.90 2.519 2.307 2174 2.082 2.014 96 1.884 What is the correct conclusion about the population means? 2.005 1.952 1.874 1.845 2.90 2.511 2.290 2.165 2.073 sufficient evidence to conclude that the population means are not all the same. 2157 1.996 1.865 1.836 2.064 1.943 1.900 2.89 2.503 2.291 Since the F-statistic in the rejection region, Ho. The data 1.935 1.892 1.857 1.827 2.88 2.495 2.283 2149 2.057 1.988 2.881 2.489 2.276 2.142 2.049 1.980 1.927 1.884 1.849 1.819